• Home

Business

  • Dashboard
  • My Products
  • Edit Business
  • My Groups

Explore

  • Articles
  • Community
  • Careers
  • Blogs
BONC logo
Get it on Google Play

Products

  • Pricing
  • Explore Industry
  • Explore Category
  • Explore Product
  • About Us

About BONC

  • FAQs
  • Terms and Condition
  • Privacy Policy
  • Refund Policy
  • Blogs

OFFICE LOCATION

Costipro Technologies Pvt. Ltd, Unit no. 235 to 245, Supremework Workspace, 2nd Floor, ILD Trade Center, Sector 47, Sohna Road, Gurgaon, Haryana - 122018

© 2025 - 2026 BONC Network. All rights reserved

BONC Logo
  • Home

Business

  • Dashboard
  • My Products
  • Edit Business
  • My Groups

Explore

  • Articles
  • Community
  • Careers
  • Blogs

Yttrium's Ninefold Price Shock: How China's Export Controls Are Reshaping Global Critical-Mineral Supply Chains

Industry ReportBy Vikas Garg · 14 Nov 2026
Yttrium's Ninefold Price Shock: How China's Export Controls Are Reshaping Global Critical-Mineral Supply Chains

A Rare Earth Becomes a Global Economic Flashpoint

The global critical-minerals market is facing another major supply-chain disruption as yttrium, a specialised rare-earth element, experiences an extraordinary increase in international prices following China's export restrictions.

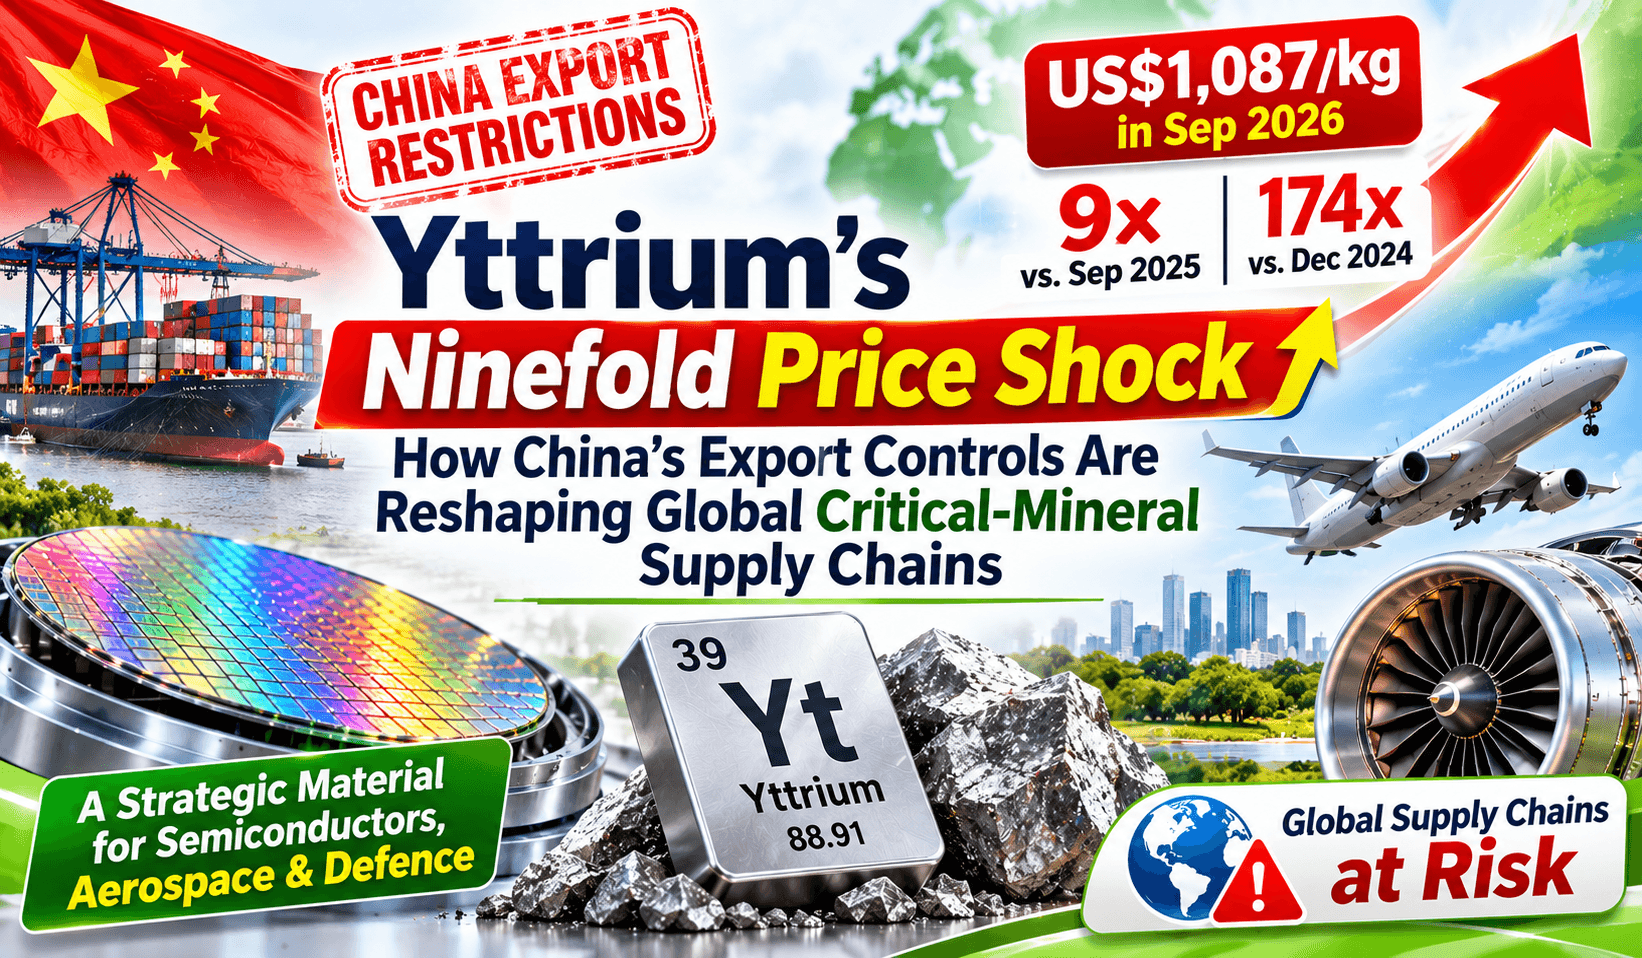
In September 2026, yttrium traded at approximately US$1,087 per kilogram in the European market, representing a ninefold increase compared with September 2025. Even more strikingly, the reported price was approximately 174 times its level at the end of 2024, before China's export restrictions began significantly affecting international availability.

The price escalation is not simply a commodity-market development. Yttrium is an important input for semiconductor manufacturing equipment, aircraft engine components, advanced ceramics, lasers, optical technologies and defense-related applications.

With China maintaining restrictions on selected rare-earth exports, manufacturers across Japan, the United States, Europe and other industrial economies are facing higher procurement costs, sourcing uncertainty and growing pressure to diversify their supply chains.

The situation demonstrates how a relatively specialised industrial material can become a strategic economic concern when its production and processing are concentrated in a limited number of countries.

What Makes Yttrium So Important?

Yttrium is one of the 17 rare-earth elements and is particularly valuable because of its chemical and physical properties.

Although it is not as widely discussed as lithium, cobalt or neodymium, yttrium plays an important role in several advanced industrial applications.

Its major uses include:

1. Semiconductor manufacturing: Yttrium oxide-based materials are used in specialised coatings for semiconductor manufacturing equipment. These coatings help protect components exposed to demanding plasma environments, supporting equipment durability and manufacturing consistency.

2. Aerospace and aircraft engines: Yttrium-based ceramic materials are used in thermal barrier coatings that help protect turbine components from extreme operating temperatures.

3. Defense and advanced technologies: Yttrium is used in specialised optical materials, lasers and technologies that support defense and precision engineering applications.

4. Electronics and lighting: Its compounds are used in phosphors, LEDs, capacitors and other electronic applications.

5. Advanced ceramics and industrial applications: Yttrium oxide is used in high-performance ceramics, optical glass, fibre-optic technologies and specialised materials.

The importance of yttrium lies not necessarily in the volume consumed but in the difficulty of replacing its performance in certain applications.

For manufacturers, a shortage of even relatively small quantities can create problems when the material is essential to a qualified production process.

The Ninefold Price Surge: Understanding the Numbers

The latest price movement highlights the severity of the supply disruption.

According to Argus Media data reported by Nikkei and Seoul Economic Daily, the European-market price of yttrium reached approximately US$1,087 per kilogram in September 2026.

The reported comparison is significant:

  • September 2025: The comparable price was approximately one-ninth of the September 2026 level, implying roughly US$121 per kilogram.

  • September 2026: Approximately US$1,087 per kilogram.

  • Year-on-year movement: Approximately nine times the previous year's price, equivalent to an increase of around 800%.

  • Compared with December 2024: Approximately 174 times higher.

The domestic Chinese market has remained substantially cheaper, with the reported international price exceeding 100 times the corresponding Chinese-market level.

This growing difference between domestic Chinese prices and international prices illustrates the widening gap between material availability inside China and access to export markets.

Japan is experiencing an equally concerning development in its import costs.

According to Japanese Ministry of Finance trade data reported in November 2026, Japan imported approximately 294 tonnes of yttrium oxide during January–September 2026, representing a decline of around 70% compared with the corresponding period in 2025.

At the same time, Japan's September import unit price for yttrium oxide was approximately 64 times its level a year earlier.

It is important to distinguish these figures: the US$1,087 benchmark refers to yttrium metal in the European market, whereas Japan's 64-fold increase relates to its import unit price for yttrium oxide. They are different product and pricing measurements, not directly interchangeable market quotations.

Nevertheless, both indicators point towards the same underlying problem: international availability is tightening while procurement costs are rising dramatically.

China's Export Restrictions: The Beginning of the Supply Disruption

The current crisis can be traced to China's decision on April 4, 2025, to introduce export controls covering seven rare-earth elements, including yttrium.

The restrictions cover relevant metals, oxides, alloys, compounds and associated products.

Under the licensing framework, exporters must obtain government approval before shipping controlled materials to international customers.

The measures emerged during escalating trade tensions between China and the United States, following Washington's tariff actions and broader restrictions affecting Chinese technology-related trade.

Although the restrictions were presented through China's export-control and national-security framework, their impact extended well beyond the immediate trade dispute.

Manufacturers that had traditionally relied on Chinese-origin materials suddenly faced additional documentation, approval requirements, uncertain delivery schedules and reduced availability.

The pressure subsequently spread across international markets.

Japan experienced additional difficulties in January 2026 when China tightened controls affecting dual-use exports destined for Japanese companies.

A further development came on November 9, 2026, when China extended the suspension of certain other rare-earth export restrictions until January 10, 2027.

However, this should not be interpreted as a complete relaxation of rare-earth controls. The April 2025 restrictions covering yttrium and six other elements remain in force.

This distinction is particularly important for international buyers expecting a rapid recovery in supplies.

Why China Holds Such Significant Influence

China's position in the rare-earth industry extends beyond mining.

Its strength lies in the integrated supply chain covering extraction, separation, refining, processing and the production of specialised materials.

According to the US Geological Survey's 2026 Mineral Commodity Summaries, estimated global mine production of yttrium contained in rare-earth mineral concentrates was approximately 10,000–15,000 tonnes in 2025.

China produced most of the estimated global yttrium supply, while Myanmar also contributed a significant share.

Separately, the International Energy Agency estimates that China accounted for approximately 61% of global mined rare-earth production and 91% of global refining and processing capacity for major rare earths in 2024.

The latter figures cover the broader rare-earth industry rather than yttrium alone, but they demonstrate the scale of China's influence over the processing infrastructure.

This concentration creates a major vulnerability.

Even when other countries possess rare-earth deposits, establishing commercially viable separation and refining facilities requires specialised technologies, investment, environmental clearances and time.

Mining a mineral is only one stage of the supply chain. Converting it into high-purity material suitable for semiconductor and aerospace applications is considerably more demanding.

Countries Facing the Greatest Impact

Japan: The Most Visible Supply-Chain Pressure

Japan has emerged as one of the most directly affected economies.

The country's semiconductor, electronics and aerospace manufacturing industries depend on reliable supplies of specialised materials.

The 70% decline in yttrium oxide import volumes during January–September 2026 highlights the seriousness of the situation.

Japanese companies are now exploring alternative procurement arrangements involving the United States, South Korea, Germany, Turkey and Estonia.

Shin-Etsu Chemical is also planning an investment exceeding ¥35 billion in a Fukui Prefecture facility capable of refining 16 rare-earth elements, including yttrium.

However, diversification will not happen immediately.

Companies must establish reliable processing capabilities, qualify alternative materials and secure long-term supply arrangements.

United States: Aerospace and Semiconductor Exposure

The United States is another major economy facing considerable exposure.

According to the USGS, the country had 100% net import reliance for yttrium in 2025, with no fully commercial domestic facility for separating or refining the material.

Shipping records for 2021–2024 indicated that approximately 70% of US imports of yttrium alloys, compounds and metals came from China. Germany accounted for 11%, Austria 8% and South Korea 4%.

The supply disruption became particularly visible in trade data.

According to Chinese customs figures analysed by the Center for Strategic and International Studies, Chinese exports of yttrium to the United States fell to just 17 tonnes during the eight months from April to December 2025, compared with 333 tonnes during the preceding eight-month period.

That represents a reduction of approximately 95%.

The impact has been felt by aerospace suppliers and specialist coating manufacturers, some of which have reportedly rationed supplies or suspended production activities.

The wider semiconductor industry is also exposed because yttrium-based materials support specialised manufacturing equipment.

South Korea: A Potential Alternative With Its Own Supply Vulnerability

South Korea is increasingly becoming part of Japan's alternative sourcing strategy.

However, there is an important complication.

South Korea does not have commercial domestic yttrium mining and remains heavily dependent on Chinese-origin rare-earth materials.

Korea Customs Service figures indicate that China accounted for approximately 89.4% of South Korea's imports of rare-earth raw materials, including yttrium, during the first nine months of 2025.

Therefore, increased Japanese imports arriving from South Korea do not necessarily represent newly diversified mineral origins.

These shipments may involve existing inventories, materials processed in South Korea or third-country supplies routed through Korean businesses.

This distinction highlights why the country of shipment and the actual country of mineral origin must not be confused.

Germany and Europe: Pressure on Advanced Manufacturing

European industrial economies are also exposed to the disruption.

Germany is particularly relevant because of its automotive, aerospace, engineering and advanced manufacturing industries.

The USGS identified Germany among the leading destinations for China's yttrium exports in 2025.

European manufacturers are exposed to higher international procurement prices and uncertainty surrounding future deliveries.

However, the wider rare-earth trade picture is not uniform. CSIS analysis indicates that European rare-earth import flows recovered more strongly than US flows following the initial restrictions.

The impact therefore varies by material, supplier, application and individual manufacturer's inventory position.

India: An Opportunity to Strengthen Domestic Capabilities

India's position deserves attention as the country expands its ambitions in electronics, defense, advanced manufacturing and strategic minerals.

India possesses rare-earth-bearing mineral resources, particularly monazite in beach-sand deposits, and has established domestic extraction and refining activities through IREL.

However, the availability of rare-earth resources does not automatically translate into commercial production of every individual rare-earth material at the required purity and scale.

World Bank trade data for 2025 show that India imported approximately 993 tonnes under HS code 280530, covering rare-earth metals, scandium and yttrium. China supplied approximately 823 tonnes, or nearly 83% by weight.

This classification covers multiple materials and does not isolate yttrium imports. It should therefore be treated as an indication of broader supply-chain exposure rather than a specific yttrium dependency measurement.

India's opportunity lies in expanding domestic separation, refining, recycling and specialised material-processing capabilities while developing diversified international supply partnerships.

Why Replacing Chinese Supplies Will Not Be Easy

The present disruption has accelerated global efforts to reduce dependence on China.

However, alternative supply chains cannot be established simply by identifying new mining locations.

The industry requires:

  • Commercially viable mining and mineral-concentrate production.

  • Advanced separation and purification technologies.

  • Consistent high-purity material quality.

  • Long-term customer qualification and testing.

  • Environmentally compliant processing facilities.

  • Reliable transportation, inventory and procurement networks.

Yttrium is especially challenging because its importance is concentrated in specialised industrial applications where material specifications and performance requirements are demanding.

Even when alternative sources become available, manufacturers may need substantial time to validate their suitability.

Consequently, international buyers are likely to focus on a combination of strategic inventories, long-term supply agreements, recycling and investment in alternative processing infrastructure.

What Comes Next for the Global Market?

The direction of the yttrium market will depend on several developments.

First, China's export licensing decisions will remain a major influence on international availability.

Second, Japan, the United States and European economies will need to accelerate their investments in alternative refining and processing capabilities.

Third, manufacturers will increasingly evaluate the cost of maintaining strategic inventories against the financial risk of production interruptions.

Fourth, the expansion of semiconductor manufacturing, aerospace production and defense-related technologies will continue to support demand for specialised materials.

Finally, new investments in rare-earth extraction and recycling could gradually improve supply diversification, although meaningful capacity expansion will take time.

Conclusion: A Small Mineral With Major Global Economic Consequences

Yttrium's extraordinary price increase demonstrates that global industrial competitiveness depends on much more than finished products, technology and manufacturing capacity.

It also depends on access to specialised raw materials that may be difficult to replace.

China's export restrictions have exposed vulnerabilities across semiconductor manufacturing, aerospace, defense and advanced electronics, forcing major economies to reconsider their sourcing strategies.

Japan's declining import volumes, the United States' supply constraints and South Korea's dependence on Chinese-origin materials demonstrate that diversification is no longer simply a long-term policy objective. It is becoming an immediate industrial priority.

For India and other emerging manufacturing economies, the situation presents an opportunity to develop stronger domestic capabilities in rare-earth processing and advanced materials.

The larger lesson is clear: Control over critical minerals is increasingly becoming a source of industrial and geopolitical influence.

As the race for advanced semiconductors, aerospace technologies and strategic manufacturing intensifies, the availability of materials such as yttrium could become just as important as the technologies they help produce.
#Yttrium#RareEarthElements#CriticalMinerals#ChinaExportRestrictions#GlobalSupplyChain#SemiconductorIndustry#AerospaceIndustry#DefenceManufacturing#CommodityMarkets#JapanEconomy#USIndustry#IndiaManufacturing#Geopolitics#AdvancedMaterials#BONCNetwork

Comments

No comments yet

Be the first to share your thoughts.

Latest Articles

View all

Company Articles

  • Best Door Hinges, Window Hinges, Stainless Steel, Brass & Mild Steel Hardware Fittings Supplier in India | INDIAN HARDWARE

    Best Door Hinges, Window Hinges, Stainless Steel, Brass & Mild Steel Hardware Fittings Supplier in India | INDIAN HARDWARE

    Ashik Mondol · few months ago

  • Premium Wash Basins, Sanitaryware & Bathroom Fittings for Residential and Commercial Projects | M/S SUPREME MARKETING

    Premium Wash Basins, Sanitaryware & Bathroom Fittings for Residential and Commercial Projects | M/S SUPREME MARKETING

    Rajesh Agarwal · few months ago

  • The Architecture of Adaptability: How the Post-Pandemic Era Rewrote the Corporate Playbook

    The Architecture of Adaptability: How the Post-Pandemic Era Rewrote the Corporate Playbook

    Vikas Garg · few months ago

  • Premium Roofing Materials, Floor & Wall Tiles, Roofing Fittings and False Ceiling Solutions in India | MURLI ENTERPRISES

    Premium Roofing Materials, Floor & Wall Tiles, Roofing Fittings and False Ceiling Solutions in India | MURLI ENTERPRISES

    Atanu Das · few months ago

  • Premium Marble, Granite, Ceramic & Porcelain Tiles Supplier in India | JAIN MARBLE CENTRE

    Premium Marble, Granite, Ceramic & Porcelain Tiles Supplier in India | JAIN MARBLE CENTRE

    Sonu Jha · few months ago

Networking Articles

  • Apple’s Nanosheet Era : The Hard Reality of 2nm Silicon

    Apple’s Nanosheet Era : The Hard Reality of 2nm Silicon

    Vikas Garg · few months ago

  • SHOPRITE AND INVESTEC JOIN FORCES TO TRANSFORM SOUTH AFRICA'S RETAIL BANKING LANDSCAPE

    SHOPRITE AND INVESTEC JOIN FORCES TO TRANSFORM SOUTH AFRICA'S RETAIL BANKING LANDSCAPE

    Global Business Outlook · few months ago

  • ⚡ THE RARE-EARTH SHOCK: YTTRIUM PRICES EXPLODE AS CHINA TIGHTENS GLOBAL SUPPLY

    ⚡ THE RARE-EARTH SHOCK: YTTRIUM PRICES EXPLODE AS CHINA TIGHTENS GLOBAL SUPPLY

    Global Business Outlook · few months ago

  • 🏦 JAPAN'S BANKING GIANTS RAISE PROFIT FORECASTS AS HIGHER INTEREST RATES BOOST EARNINGS

    🏦 JAPAN'S BANKING GIANTS RAISE PROFIT FORECASTS AS HIGHER INTEREST RATES BOOST EARNINGS

    Global Business Outlook · few months ago

  • Mitsui Chemicals–JSR Mega Deal: A ¥1.84 Trillion Bet on the Future of Semiconductor Manufacturing

    Mitsui Chemicals–JSR Mega Deal: A ¥1.84 Trillion Bet on the Future of Semiconductor Manufacturing

    BONC NETWORK · few months ago

More from Vikas Garg

Apple’s Nanosheet Era : The Hard Reality of 2nm Silicon
Trend & Future Insight

Apple’s Nanosheet Era : The Hard Reality of 2nm Silicon

Global semiconductor landscape - The Commercial and Technical Realities of 2nm Silicon The move to 2-nanometer (2nm) Gate-All-Around (GAA) nanosheet architecture—headlined by TSMC’s N2 node—represents a massive leap in mobile processing. However, bringing this technology to mass production has introduced severe financial pressures, manufacturing yield friction, and physical thermal limits. For enterprise tech leaders, hardware strategists, and supply chain executives, this shift is more than an incremental performance bump. It represents a fundamental shift in foundry economics, thermal management, and long-term hardware roadmap planning. 1. Physical Scale and Benchmark Data Transitioning from 3nm FinFET structures to 2nm GAA nanosheets alters key physical and operational performance metrics. Transistor Density Expansion: Logic blocks on 2nm nodes achieve a density between 310 million and 330 million transistors per square millimeter. This reflects a 15% to 20% density gain over previous 3nm iterations within a compact die footprint of approximately 98.8 square millimeters. Frequency and Clock Scaling: Peak clock frequencies on custom performance cores push toward 4.93 GHz, delivering higher single-core instruction throughput without expanding total physical processor dimensions. Power-to-Performance Ratios: At equivalent clock speeds, power draw decreases by 25% to 30% compared to 3nm baseline designs. Conversely, running at equivalent power levels delivers a 10% to 15% net performance increase. Benchmark Projections: Synthetic execution tests demonstrate these gains, with single-core benchmark scores reaching approximately 4,719 and multi-core output climbing to roughly 12,677. AI Acceleration and On-Chip Memory: On-chip memory bandwidth expands by 50% compared to traditional stacked configurations. Furthermore, integrated 32-core neural processing engines double matrix multiplication throughput, allowing on-device handling of artificial intelligence parameters scaling up to 27 billion parameters. 2. Foundry Economics, Wafer Costs, and Yield Bottlenecks Transitioning to 2nm nanosheets requires unprecedented capital expenditure, altering production economics across the high-performance computing sector: The $30,000 Wafer Barrier: A single 12-inch 2nm silicon wafer is estimated at approximately $30,000—a 50% increase compared to the $18,000 to $20,000 cost range of 3nm wafers. Per-Unit Cost Escalation: Estimated production costs per completed logic die climb to near $280 per unit, up from roughly $150 per unit in prior node generations. This cost inflation forces primary designers to choose between absorbing reduced gross margins or passing hardware costs up the enterprise value chain. Fabrication Yield Friction: Early trial runs on 2nm nodes report functional die yields in the 60% to 65% range. Sustained commercial mass production requires consistent yields above 70% to 75% to prevent severe silicon waste. Photolithography Complexity: Constructing 2nm nanosheet channels involves up to 100 photolithography layers utilizing complex Extreme Ultraviolet (EUV) multi-patterning, raising the risk of micro-defects during atomic layer deposition. 3. Engineering Friction: Heat Density, Packaging, and Power Delivery Compressing hundreds of millions of transistors into tight square-millimeter boundaries creates immediate operational bottlenecks: Thermal Density and Localized Hotspots While 2nm GAA reduces passive off-state current leakage, concentrating over 300 million transistors per square millimeter generates extreme localized thermal density. Under continuous high-GPU or heavy AI loads, performance cores operating near 4.9 GHz create severe micro-hotspots. Without rapid, direct-to-die thermal spreading, systems hit thermal trip limits, forcing aggressive clock throttling within 90 seconds of peak execution. The Memory Packaging Bottleneck Traditional Package-on-Package (PoP) structures—which stack dynamic RAM directly on top of the processor—create an insulated thermal sandwich under heavy compute cycles. To prevent memory thermal degradation, 2nm architectures are shifting to side-by-side Wafer-Level Multi-Chip Modules (WMCM). Placing memory adjacent to the primary logic die on a shared interposer increases bandwidth by 50%, but it requires more horizontal motherboard footprint and demands advanced internal vapor-chamber cooling integration. Power Delivery and Wiring Congestion Initial 2nm nodes continue to rely on frontside power delivery, where power lines and signal traces compete for routing space on top of the wafer. This layout creates wiring congestion and voltage drops under maximum workloads. Until revised nodes implement backside power rails to route power from the rear of the wafer, initial 2nm platforms must rely on complex micro-routing workarounds to prevent sudden voltage droop. Strategic Takeaways for B2B Leaders Prioritizing Sustained Efficiency Over Burst Clock Rates: Executive procurement and product strategy must evaluate sustained performance-per-watt rather than advertised peak burst clock speeds, as thermal throttling will dictate real-world enterprise performance. Capital-Intensive Supply Chains: High wafer expenses and complex yield curves will concentrate early 2nm access among top-tier volume buyers, creating a multi-year gap before mid-tier hardware manufacturers can cost-effectively integrate 2nm silicon. Packaging as the New Differentiator: System performance is no longer driven solely by node shrinks. Advanced modular packaging, thermal dissipation design, and unified memory architecture will be as critical as transistor size in defining modern compute efficiency. What's future looks like for the Industry and Shift To navigate the 2nm era, the semiconductor industry must shift focus from pure node shrinking to holistic silicon co-design. Success will require accelerating advanced 3D packaging innovations, securing resilient supply chains against soaring wafer costs, and optimizing hardware specifically for sustained, thermal-efficient AI execution. Ultimately, the future of chip design belongs to architectures that master the balance between raw computing density, economic viability, and real-world power management. Some pointers to think through: On Capital Allocation & ROI: With 2nm wafers approaching $30,000, how is your organization balancing the premium cost of next-generation hardware against actual performance gains in real-world enterprise workloads? On Architectural Strategy: As thermal throttling limits raw clock speed gains, should enterprise tech roadmaps prioritize node shrinks or shift investment toward advanced modular packaging and custom silicon architectures? On Edge AI Infrastructure: How will the high power demands and thermal realities of continuous on-device AI processing reshape mobile workforce deployment and hardware refresh cycles over the next three years?

#apple#iphone#Semiconductors
Vikas Garg
Merck KGaA and the B2B Life Sciences Disparity
Case Study

Merck KGaA and the B2B Life Sciences Disparity

A critical study in global contribution versus relative enterprise size is demonstrated by Merck KGaA (headquartered in Darmstadt, Germany). Founded in 1668, Merck KGaA is the world's oldest operating pharmaceutical and chemical company, yet it operates at less than half the financial scale of US-based Merck & Co. , which split into an independent entity following World War I. Merck KGaA generated €21.1 billion (~$22.8 billion USD) in net sales with an EBITDA pre of €6.1 billion (representing a 28.9% margin ) and organic growth of +3.1% . In contrast to US pharma titans whose growth stems from direct-to-patient mega-blockbuster therapies, Merck KGaA functions as a diversified three-pillar conglomerate : Life Science (MilliporeSigma): Accounting for ~€8.9 billion (~42% of total group revenue) , this segment provides essential process solutions, single-use bioreactors, filtration systems, and scientific lab reagents. Healthcare: Generates ~€8.0 billion , focused on specialized niche sectors such as fertility treatments ( Pergoveris ), neurology ( Mavenclad ), and specific oncology platforms. Electronics: Generates ~€3.5 billion to €4.0 billion , supplying high-tech liquid crystals and semiconductor materials essential for global microchip manufacturing. Structural Barriers to Merck KGaA’s Relative Expansion The disparity in scale between Merck KGaA and pure-play pharmaceutical giants stems from four primary operational dynamics: The B2B Multiplier vs. Consumer Blockbusters: Merck KGaA’s Life Science division operates primarily as a B2B supplier. While selling bioreactors and reagents creates sticky, predictable revenue, it scales linearly with lab R&D budgets. It does not generate the explosive, multi-billion dollar single-asset revenue surges seen in direct consumer therapeutics—demonstrated by the fact that Merck & Co.’s single oncology drug Keytruda ( $29.50 billion ) generates more revenue than Merck KGaA’s entire multi-industry group combined. Capital Diversification Across Sectors: Merck KGaA splits its capital allocation across semiconductor chemicals, lab equipment, and specialized pharma. In contrast, mega-pharma competitors channel tens of billions directly into single therapeutic arms (such as oncology or metabolic GLP-1 weight-loss drugs), driving single-year organic growth rates of 30% to 45% . Post-Pandemic Inventory Corrections: Following peak pandemic production of vaccines and biologics, global pharmaceutical clients over-purchased bioprocessing equipment. This triggered an extended destocking hangover across the life science sector, temporarily flattening organic growth before stabilizing. Geographic Brand Constraints: Due to the historical post-WWI separation, Merck KGaA cannot use the master name "Merck" in North America—the world's largest healthcare market—and must operate under MilliporeSigma , diluting global master-brand equity compared to its US counterpart. Systemic Contribution to the Global Healthcare Infrastructure Despite generating lower overall revenue than pure-play therapeutic giants, Merck KGaA's operational footprint forms an indispensable backbone of global medicine: Biomanufacturing Backbone: The vast majority of global biologics, cell therapies, and mRNA vaccines cannot be developed, purified, or scaled to commercial volumes without Merck KGaA's filtration media and bioprocessing assemblies. Technology Supply Convergence: Through its semiconductor materials division, Merck KGaA underpins the raw material supply chain required for microchip manufacturing, creating a dual dependency in both modern healthcare technology and global digital infrastructure. Through structural patent thickets, clinical trial gatekeeping, and heavy M&A capital, the top ten pharmaceutical corporations continue to lock in direct market exclusivity. Concurrently, foundational suppliers like Merck KGaA ensure that behind this financial exclusivity lies a centralized, indispensable manufacturing infrastructure upon which global health remains dependent. Conclusively - Merck KGaA's slower relative growth and smaller size compared to Merck & Co. is not a failure of execution, but a consequence of business design . While Merck & Co. functions as a high-stakes, high-reward therapeutic giant capitalizing on mega-blockbuster drugs, Merck KGaA operates a diversified, highly stable B2B life science and technology conglomerate model designed for steady, long-term compounding rather than explosive, single-drug-driven market surges.

#MerckKGaA#MerckAndCo#LifeSciences
Vikas Garg
Financial Titans: Inside the Top 10 Wealthiest Families in the World
Research Paper

Financial Titans: Inside the Top 10 Wealthiest Families in the World

When evaluating long-term financial success, conversations typically focus on individual billionaires. However, the most resilient financial legacies belong to family dynasties that have built, scaled, and protected enterprises across multiple generations, transforming local ventures into global economic powerhouses. According to Bloomberg’s ranking, the world’s 25 richest families hold a combined estimated wealth of $2.9 trillion—a significant increase driven by public market performance, robust consumer demand, and strategic diversification. Examining these top 10 dynasties reveals how specific operating models, high-impact mergers, and adaptive pivots into new-age solutions have preserved their fortunes. 1. The Walton Family (USA) Estimated Wealth: $513.4 billion Core Enterprise: Walmart Generations: 3 Key Business Operations & Expansion: Founded by Sam Walton, Walmart operates the world's largest retail and wholesale corporation. The family's sustained dominance is built on massive supply-chain efficiency, high-volume inventory turnover, and aggressive pricing strategies. New-Age & Strategic Shifts: To combat digital disruption and rival e-commerce giants, the Waltons aggressively expanded Walmart's digital footprint through omnichannel retail, automated fulfillment centers, and investments in cloud infrastructure, fintech services, and drone delivery logistics. 2. The Al Nahyan Family (UAE) Estimated Wealth: $335.9 billion Core Enterprise: Abu Dhabi Sovereign Wealth & State Industrial Interests Generations: 3 Key Business Operations & Expansion: As the ruling royal family of Abu Dhabi, their financial strength is anchored by massive petroleum reserves managed through sovereign investment vehicles like the Abu Dhabi Investment Authority (ADIA) and Mubadala Investment Company. New-Age & Strategic Shifts: Operating with a long-term post-oil vision, the family has funneled billions into artificial intelligence, renewable energy initiatives, semiconductor manufacturing, and global tech venture capital funds to diversify away from hydrocarbons. 3. The Al Saud Family (Saudi Arabia) Estimated Wealth: $213.6 billion Core Enterprise: Saudi Arabian Oil Company (Saudi Aramco) & State Assets Generations: 3 Key Business Operations & Expansion: The Saudi royal family commands immense economic gravity primarily through control of Saudi Aramco, one of the world's most profitable energy corporations, alongside expansive state-backed real estate and industrial holdings. New-Age & Strategic Shifts: Through the Public Investment Fund (PIF), the dynasty is spearheading Vision 2030, driving mega-projects like NEOM, investing heavily in green hydrogen, global sports infrastructure, and next-generation tech startups. 4. The Al Thani Family (Qatar) Estimated Wealth: $199.5 billion Core Enterprise: State Energy & International Investments Generations: 8 Key Business Operations & Expansion: Qatar’s ruling family derives its strength from the nation's colossal liquefied natural gas (LNG) reserves, managed via the Qatar Investment Authority (QIA). New-Age & Strategic Shifts: The family has methodically converted energy windfalls into global trophy assets, high-profile real estate across major financial capitals, and strategic stakes in international banking, telecommunications, and green tech enterprises. 5. The Hermès Family (France) Estimated Wealth: $184.5 billion Core Enterprise: Hermès International Generations: 6 Key Business Operations & Expansion: Built on ultra-exclusive luxury goods, leather craftsmanship (such as the Birkin and Kelly bags), and ready-to-wear fashion, the family maintains tight corporate control to safeguard brand exclusivity over mass production. New-Age & Strategic Shifts: Unlike competitors that lean heavily into mass-market digital exposure, Hermès has maintained strict scarcity models while upgrading digital clienteling platforms and investing heavily in sustainable, ethically sourced luxury materials. 6. The Koch Family (USA) Estimated Wealth: $150.5 billion Core Enterprise: Koch Industries Generations: 3 Key Business Operations & Expansion: Operating as one of the largest private conglomerates in the world, Koch Industries spans petroleum refining, chemicals, polymers, fiber, forest products, and electronic components. New-Age & Strategic Shifts: The family has continuously executed multi-billion-dollar acquisitions and internal restructuring to pivot toward industrial software, medical technology investments, and market-based venture capital initiatives. 7. The Mars Family (USA) Estimated Wealth: $143.4 billion Core Enterprise: Mars, Incorporated Generations: 5 Key Business Operations & Expansion: Globally renowned for confectionery giants like M&M’s, Snickers, and Wrigley, the family engineered massive horizontal expansion into pet care, veterinary health services, and food manufacturing. New-Age & Strategic Shifts: Recent major corporate maneuvers include multi-billion-dollar acquisitions in veterinary diagnostics and pet health data platforms, positioning the company securely inside high-growth consumer health sectors. 8. The Ambani Family (India) Estimated Wealth: $105.6 billion Core Enterprise: Reliance Industries Limited (RIL) Generations: 2 Key Business Operations & Expansion: Founded by Dhirubhai Ambani and scaled under Mukesh Ambani, Reliance transitioned from a textile player into an energy and petrochemical giant before executing a historic expansion into organized retail and digital telecom services (Reliance Jio). New-Age & Strategic Shifts: The family is currently driving a massive green energy transition—investing heavily in solar, hydrogen, and battery storage infrastructure—while scaling up 5G/6G digital ecosystems and AI-driven consumer tech platforms. 9. The Wertheimer Family (France) Estimated Wealth: $85.6 billion Core Enterprise: Chanel Generations: 3 Key Business Operations & Expansion: The brothers Alain and Gérard Wertheimer own the legendary luxury fashion house Chanel, maintaining private ownership that emphasizes long-term brand equity, haute couture, and premium fragrances. New-Age & Strategic Shifts: The family has focused on selective digital integration, experiential retail flagships, and minority venture investments in sustainable fashion startups and alternative textile material developers. 10. The Thomson Family (Canada) Estimated Wealth: $82.1 billion Core Enterprise: Thomson Reuters Generations: 3 Key Business Operations & Expansion: Controlled through their investment vehicle Woodbridge Company, the family derives its wealth primarily from a majority stake in Thomson Reuters, providing essential data, legal software, tax compliance tools, and financial market media globally. New-Age & Strategic Shifts: The company has undergone a major software-as-a-service (SaaS) and AI transformation, acquiring legal tech platforms and integrating generative AI tools into core regulatory and workflow products. Strategic Takeaways on Generational Wealth Preservation Analyzing these dynasties highlights that maintaining colossal wealth requires far more than passive asset holding. Whether through the heavy capital reallocation seen in the Ambani and Al Nahyan families or the steadfast brand preservation practiced by Hermès and Chanel, long-term survival depends heavily on calculated diversification, disciplined operational execution, and the agility to embrace new-age industrial solutions ahead of market shifts.

#GenerationalWealth#FamilyDynasties#BillionaireFamilies
Vikas Garg
Is India’s Property Market Heading Towards a Recession in 2026?
Market Study

Is India’s Property Market Heading Towards a Recession in 2026?

India’s real estate market has experienced an extended phase of robust expansion, but 2026 presents a more nuanced picture. With property price appreciation outpacing wage growth in key urban hubs, affordability hurdles, and rising inventory in selective segments, a critical question emerges: Is the property market moving toward a recession, or simply entering a disciplined correction and consolidation phase? What Is Happening in the Market? The national numbers for 2026 show steady resilience mixed with localized caution. Across the top eight primary cities, cumulative housing sales for the first nine months reached 258,238 units , holding flat compared to the previous year. Meanwhile, overall residential inventory across major urban centers ticked upward, with available stock hovering near 5.31 lakh to 6.31 lakh units , driven by aggressive new project launches. Average residential prices across top markets have crossed the ₹9,700 per sq. ft. mark (reflecting a ~7% year-on-year increase). This divergence indicates that overall buyer demand has not collapsed, but the velocity of absorption varies drastically by city, micro-market, and price bracket. Why Is the Market Slowing Down? Several fundamental economic pressures are tempering market momentum: The Affordability Gap: In several high-growth micro-markets, capital values have surged faster than household disposable incomes, compressing the pool of active, first-time home buyers. Financing and Cost of Capital: With broader monetary tightening cycles keeping borrowing costs elevated, home loan interest rates demand a higher out-of-pocket commitment, leading buyers to exercise greater caution before finalizing transactions. Supply Mismatch: New project completions have heavily favored luxury and ultra-luxury configurations, whereas mid-income and affordable housing supply has faced tighter demand compression. Micro-Market Trends & Price Appreciation (2026 Data Analysis) Real estate performance in 2026 is hyper-local. Evaluating specific city trends reveals stark differences in pricing and momentum: Delhi-NCR & Gurugram: NCR has experienced distinct movements, with overall sales adjusting dynamically (recording 10,712 units in Q3), while price appreciation remains among the highest nationally at 12% to 15% year-on-year . Gurugram continues to do the heavy lifting: premium corridors like Golf Course Extension Road, Southern Peripheral Road (SPR), and Dwarka Expressway have witnessed massive long-term gains (30% to 50%+ appreciation over recent cycles), pushing average prices in prime sectors near ₹18,500+ per sq. ft. Noida has also maintained steady traction with ~7% to 11% price growth, backed by commercial expansion and proximity to the upcoming Jewar Airport region. Mumbai Metropolitan Region (MMR): MMR remains India's undisputed volume and revenue leader, recording approximately 31,750 units sold in recent quarters and holding the largest share of national real estate revenue (~28.4%). Driven by continuous infrastructure upgrades and redevelopment projects, average prices stand firm around ₹37,064 per sq. ft. in core zones, alongside active supply in peripheral nodes like Navi Mumbai and Thane. Bengaluru: Bengaluru stands out as one of the country's most resilient markets, registering a 11% to 24% year-on-year price appreciation alongside steady sales growth (~12% increase in key quarters). Powered by stable GCC and tech sector employment, micro-markets along expanding metro lines continue to see healthy end-user absorption, though new launches lean increasingly into the ₹80 lakh to ₹2.5 crore bracket. Hyderabad: Hyderabad has displayed aggressive supply dynamics, recording a 15% year-on-year sales jump in key quarters alongside a massive surge in new launches (up over 120% annually). With average prices appreciating at a steady ~3% to 8% and 97% of new supply targeted above ₹80 lakh, the city is betting heavily on premium and upscale integrated developments. Will Property Prices Fall in 2026? A broad, nationwide price crash remains unlikely. Instead, the market is displaying stark bifurcation: High-Demand Micro-Markets: Premium properties backed by robust infrastructure delivery—such as upcoming metro lines and expressway expansions—continue to command steady end-user absorption. Correction-Prone Pockets: Overpriced projects or over-supplied micro-markets are facing extended inventory clearance times. In these segments, developers are increasingly relying on flexible payment subventions, festive discounts, and customized incentives to move inventory. My Take: A Healthy Reality Check The core concern for 2026 is not an imminent market crash, but whether asset valuations are disconnecting from what ordinary, salaried homebuyers can realistically sustain. A resilient real estate ecosystem requires a fine equilibrium between developer pricing expectations and consumer purchasing power. While macro pressures and higher inventory create localized stagnation, disciplined adjustments by developers can stabilize the market organically. Ultimately, India’s real estate landscape in 2026 is navigating a phase of structural adjustment rather than a confirmed nationwide recession . For both home-buyers and long-term capital allocators, data-backed research, careful asset selection, and long-term horizons remain the ultimate safeguards against market noise.

#MarketCorrection#RealEstateRecession#PropertyPrices
Vikas Garg