• Home

Business

  • Dashboard
  • My Products
  • Edit Business
  • My Groups

Explore

  • Articles
  • Community
  • Careers
  • Blogs
BONC logoGet it on Google Play

Products

  • Pricing
  • Explore Industry
  • Explore Category
  • Explore Product
  • About Us

About BONC

  • FAQs
  • Terms and Condition
  • Privacy Policy
  • Refund Policy
  • Blogs

OFFICE LOCATION

Costipro Technologies Pvt. Ltd, Unit no. 235 to 245, Supremework Workspace, 2nd Floor, ILD Trade Center, Sector 47, Sohna Road, Gurgaon, Haryana - 122018

© 2025 - 2026 BONC Network. All rights reserved

BONC Logo
  • Home

Business

  • Dashboard
  • My Products
  • Edit Business
  • My Groups

Explore

  • Articles
  • Community
  • Careers
  • Blogs

Inside the $1 Trillion+ Defense Shift: AI Drones, Nuclear Modernization, and Record Budgets

Trend InsightBy BONC NETWORK · 26 Oct 2026
Inside the $1 Trillion+ Defense Shift: AI Drones, Nuclear Modernization, and Record Budgets

The Global Defense Modernization Paradigm: Budgetary Expansion, Technological Breakthroughs, and Strategic Realignment

The global defense landscape is experiencing a structural transition characterized by rapid technological integration, record-breaking defense allocations, and a strategic pivot from traditional deterrence toward multi-domain, highly autonomous, and network-centric warfare. Leading powers and international defense bodies are executing unprecedented modernizations to address complex geopolitical dynamics, supply chain vulnerabilities, and the emergence of asymmetric threat vectors.

At the center of this transformation is a massive reallocation of financial capital toward capital expenditure, research and development (R&D), and civil-military technological fusion. This comprehensive analysis covers global budgetary dynamics, emerging technology implementations, institutional governance changes, and key financial and strategic metrics shaping global defense policy.

1. Global Defense Financial Architecture & Budget Allocations

Recent national budget releases highlight an aggressive upward trajectory in overall defense spending, with significant growth shifted toward long-term modernization projects, capital outlays, and advanced platform acquisitions.

Key Financial Insights & Capital Breakdown

  • United States Budgetary Acceleration:

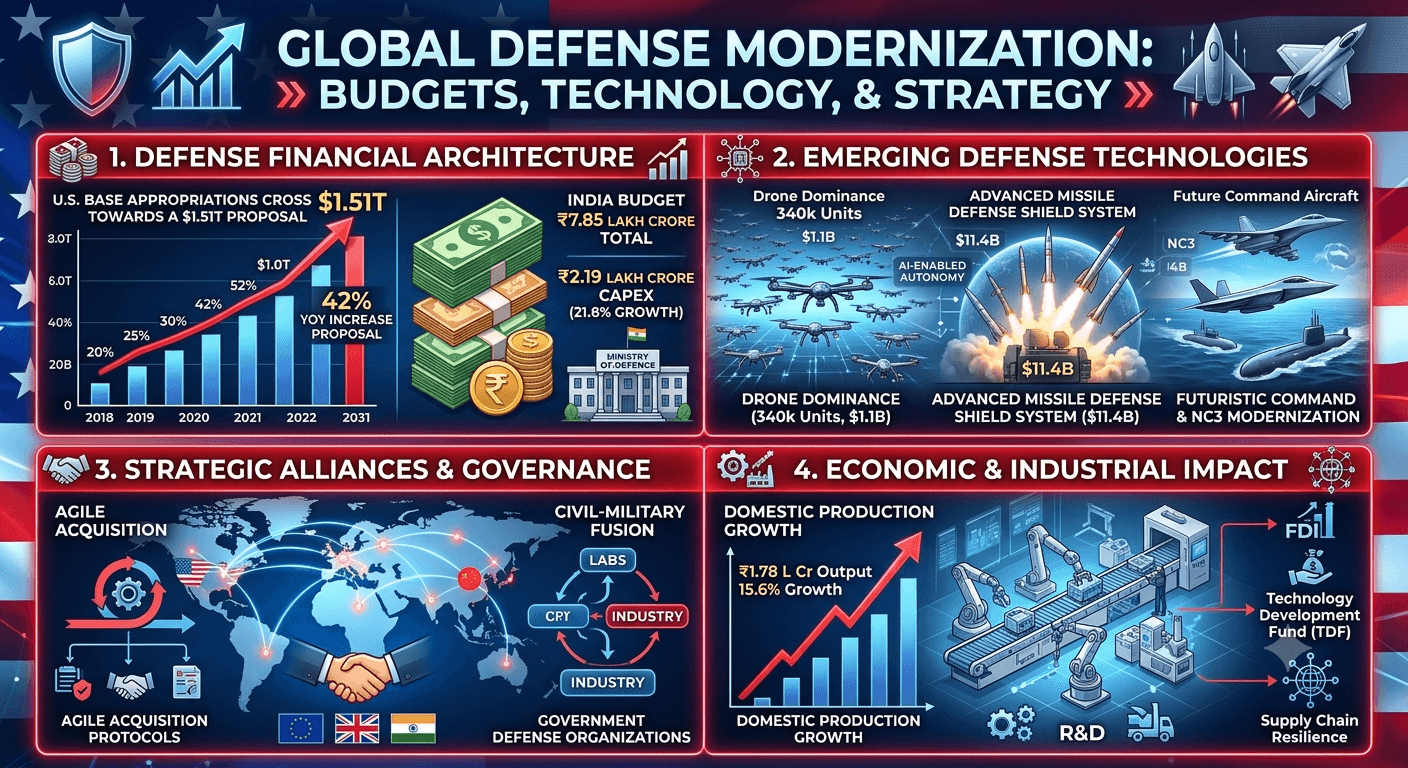
    • The U.S. defense spending framework passed a historic milestone by crossing $1.0 trillion in FY 2026, with an ambitious FY 2027 proposal of $1.51 trillion representing a 42% year-over-year increase.

    • The FY 2027 discretionary request accounts for $1.15 trillion (a 28% baseline increase), supplemented by $350 billion in mandatory reconciliation funding.

    • Capital allocation focuses heavily on strategic modernization, including over $756.8 billion allocated to industrial capabilities, $75+ billion to space-based assets, and $20+ billion to cyber defense infrastructure.

  • India's Modernization Shift:

    • The Ministry of Defence received an all-time high allocation of ₹7.85 lakh crore ($85.7 billion) for FY 2026–27, marking a 15.2% YoY overall increase.

    • Capital expenditure (CapEx) experienced a significant 21.8% growth, reaching ₹2.19 lakh crore ($23.9 billion), excluding civil outlays.

    • CapEx now accounts for 37.7% of the total defense budget (excluding pensions), signaling a deliberate departure from revenue-heavy operational maintenance toward next-generation hardware and platform inductions.

    • Revenue expenditure for operational readiness and troop maintenance stands at ₹3.65 lakh crore ($39.9 billion)—a 16.6% increase—with ₹88,053 crore ($9.62 billion) earmarked specifically for repairs, stores, and civil works.

2. Emerging Technologies and Operational Capabilities

Military forces are transitioning from hardware-centric platforms to software-defined, autonomous, and artificial intelligence-enabled environments. Modern battlefields prioritize speed, scalability, distributed lethality, and operational survivability.

Primary Focus Areas

  • Autonomous Unmanned Aerial Systems (UAS) & Drone Dominance:

    • Mass Procurement Scale: Tactical doctrine is heavily focusing on uncrewed systems. Initiatives like the $1.1 billion Drone Dominance Programme aim to field approximately 340,000 small, weaponized, and autonomous UAS to forward combat units.

    • Funding Allocation Growth: Global counter-UAS and autonomous technology budgets have tripled, with tactical drone/counter-drone investments reaching $74 billion in U.S. requests.

  • Advanced Missile Systems & Integrated Air Defense:

    • Terminal and Exo-Atmospheric Shielding: Allocation for missile defense includes $11.4 billion earmarked for Terminal High Altitude Area Defense (THAAD) interceptors (procuring 857 units, with a baseline of 450+ interceptors annually through 2031).

    • Ground-Based Midcourse Defense (GMD): Midcourse defense R&D funding expanded by 83.2%, growing from $764 million to $1.4 billion.

    • Glide-Phase Interceptors & Advanced Sensors: Glide-phase interceptor programs rose to $214 million (+15.6%), while specialized tracking sensor development saw a 372.6% increase from $183 million to $865 million.

  • Nuclear Modernization & Strategic Command, Control, and Communications (NC3):

    • Sea-Based Deterrence: Funding for the Trident II Life Extension Program escalated to $3.9 billion, while W93 warhead Mark 7 aeroshell R&D expanded from $619 million to $841 million (+35.8%).

    • Airborne Command Platforms: NC3 survivability investments increased the Survivable Airborne Operations Center (E-4 replacement) budget from $1.8 billion to $2.2 billion (+22.2%) and the E-130J platform (E-6B Mercury replacement) from $1.2 billion to $1.9 billion (+58.3%).

  • Naval Fleet Expansion & Maritime Subsurface Deterrence:

    • Maritime force structure emphasizes stealth frigates and nuclear-powered ballistic missile submarines (SSBNs). Recent operational developments include the commissioning of the 3rd Arihant-class SSBN (INS Aridaman) and completion of the P-75 submarine series (INS Vaghsheer), supporting a strategic goal of an operational 170+ vessel fleet.

3. Institutional Governance, Policy Frameworks, and Strategic Alliances

Government defense organizations, ministries, and procurement agencies are overhauling procedural regulations to accelerate technological adoption and strengthen domestic industrial ecosystems.

Strategic Governance Initiatives

  • Transition to Agile Acquisition Protocols:

    • Military organizations are replacing rigid acquisition frameworks with Agile Acquisition Protocols. This procedural evolution allows rapid spiral development, iterative prototyping, and continuous software deployment rather than requiring fully locked hardware specifications prior to initial production.

  • Institutionalizing Civil-Military Fusion:

    • National defense authorities are establishing formal Civil-Military Fusion Frameworks to bridge commercial technology sectors and defense laboratories. This approach accelerates the deployment of dual-use technological advances, including quantum computing, generative AI, edge computing, and commercial satellite communications.

    • Partnering initiatives, such as the Development cum Production Partner (DcPP) Model, have engaged over 134 corporate entities alongside major R&D organizations, producing 2,180+ technology transfer agreements and opening 2,780+ intellectual property rights (IPRs) to private defense manufacturers.

  • Bi-Lateral Security Coalitions & Bilateral Pacts:

    • Strategic realignments include landmark international security pacts, such as the EU-India Security and Defence Partnership, which expanded cross-border cooperation in cyber resilience, maritime domain awareness, space domain tracking, and joint supply chain security.

4. Economic Dynamics: Indigenization, R&D, and Foreign Direct Investment

Defense industrial policies are prioritizing domestic production capacity, supply chain self-reliance, and reduced dependency on foreign Original Equipment Manufacturers (OEMs).

Industrial Base Growth Highlights

  • Domestic Manufacturing Output: Annual domestic defense output reached ₹1,78,000 crore ($19.4 billion), representing a 15.6% YoY growth over the previous year's ₹1,54,071 crore, and an aggregate 110% expansion compared to FY 2020–21 (₹84,643 crore).

  • Deep-Tech R&D Funding: Governments are deploying targeted venture funding mechanisms, such as an additional ₹500 crore corpus directed to the Technology Development Fund (TDF), supporting active deep-tech developments in microelectronics, stealth materials, and autonomous algorithms.

  • Foreign Direct Investment (FDI) & Co-Development: Cumulative FDI inflows into defense manufacturing reached ₹6,670.59 crore, supported by regulatory adjustments such as Basic Customs Duty (BCD) exemptions on raw materials and components imported for domestic Aircraft Parts Manufacturing and Maintenance, Repair, and Overhaul (MRO) facilities.

5. Strategic Outlook and Future Challenges

While increased funding and accelerated technological deployment enhance operational capabilities, defense sectors globally encounter critical operational and structural challenges:

  • Pensions and Revenue Absorption Balance: High personnel costs and pension liabilities (accounting for ₹1.71 lakh crore in specific major budgets) continue to compete with capital modernization accounts.

  • Industrial Absorptive Capacity: Domestic manufacturing bases must balance rapid technological integration with quality assurance and supply chain scaling to prevent delivery bottlenecks.

  • Multi-Domain Command Integration: Achieving unified operational execution across joint forces requires standardizing legal, logistical, administrative, and software systems across ground, air, naval, cyber, and space domain commands.
BONC Network

#DefenseIndustry#DefenseTechnology#DefenseModernization#GlobalDefense#DefenseSpending#DefenseBudget#Geopolitics#DefenseProcurement#IndustrialBase#StrategicInvestment#MilitaryExpenditure#boncnetwork

Comments

No comments yet

Be the first to share your thoughts.

Latest Articles

View all

Company Articles

  • Best Door Hinges, Window Hinges, Stainless Steel, Brass & Mild Steel Hardware Fittings Supplier in India | INDIAN HARDWARE

    Best Door Hinges, Window Hinges, Stainless Steel, Brass & Mild Steel Hardware Fittings Supplier in India | INDIAN HARDWARE

    Ashik Mondol · few months ago

  • Premium Wash Basins, Sanitaryware & Bathroom Fittings for Residential and Commercial Projects | M/S SUPREME MARKETING

    Premium Wash Basins, Sanitaryware & Bathroom Fittings for Residential and Commercial Projects | M/S SUPREME MARKETING

    Rajesh Agarwal · few months ago

  • The Architecture of Adaptability: How the Post-Pandemic Era Rewrote the Corporate Playbook

    The Architecture of Adaptability: How the Post-Pandemic Era Rewrote the Corporate Playbook

    Vikas Garg · few months ago

  • Premium Roofing Materials, Floor & Wall Tiles, Roofing Fittings and False Ceiling Solutions in India | MURLI ENTERPRISES

    Premium Roofing Materials, Floor & Wall Tiles, Roofing Fittings and False Ceiling Solutions in India | MURLI ENTERPRISES

    Atanu Das · few months ago

  • Premium Marble, Granite, Ceramic & Porcelain Tiles Supplier in India | JAIN MARBLE CENTRE

    Premium Marble, Granite, Ceramic & Porcelain Tiles Supplier in India | JAIN MARBLE CENTRE

    Sonu Jha · few months ago

Networking Articles

  • India’s Strategic $22 Billion Defense Modernization Surge

    India’s Strategic $22 Billion Defense Modernization Surge

    BONC NETWORK · few months ago

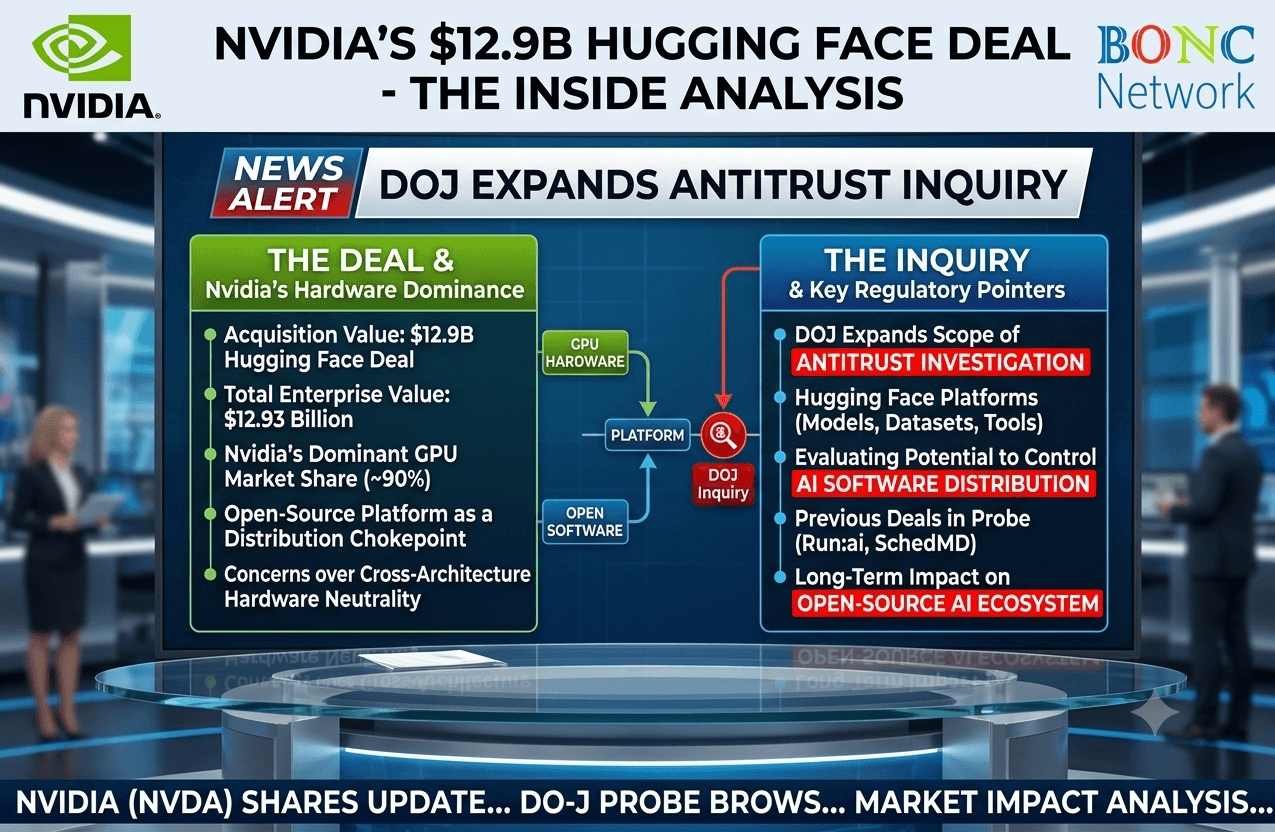
  • Nvidia’s $12.9B Hugging Face Deal - DOJ Expands Antitrust Inquiry

    Nvidia’s $12.9B Hugging Face Deal - DOJ Expands Antitrust Inquiry

    BONC NETWORK · few months ago

  • Morocco’s Rise Signals a New Investment Landscape in Africa: Manufacturing, Infrastructure and Economic Reforms Reshape Investor Priorities

    Morocco’s Rise Signals a New Investment Landscape in Africa: Manufacturing, Infrastructure and Economic Reforms Reshape Investor Priorities

    Global Bserve · few months ago

  • Dubai's Strategic Leap: Sheikh Hamdan Approves $544M Urban Plan, Sustainable Population Policy, and Digital Authorisation System

    Dubai's Strategic Leap: Sheikh Hamdan Approves $544M Urban Plan, Sustainable Population Policy, and Digital Authorisation System

    Consulting Expert · few months ago

  • Anthropic’s Landmark S-1 Public Filing: Scale, Financial Liabilities, and Mission Governance

    Anthropic’s Landmark S-1 Public Filing: Scale, Financial Liabilities, and Mission Governance

    BONC NETWORK · few months ago

More from BONC NETWORK

India’s Strategic $22 Billion Defense Modernization Surge
Industry Report

India’s Strategic $22 Billion Defense Modernization Surge

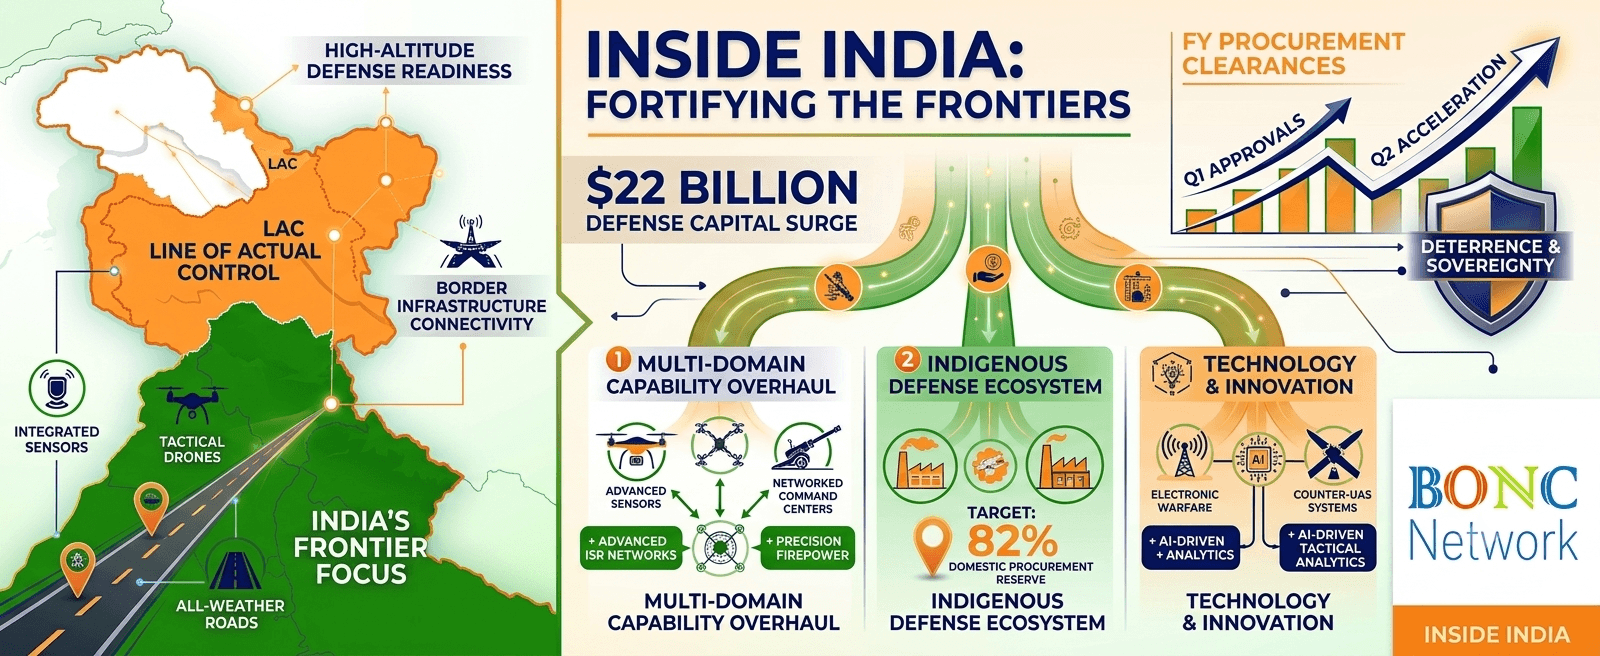
In an assertive push to safeguard national sovereignty, enhance multi-domain deterrence capabilities, and systematically reshape the regional balance of power, New Delhi has granted in-principle administrative approval for a massive ₹2.12 trillion ($22.27 billion) military spending blueprint . This major financial outlay comes at a critical juncture as continuous strategic requirements along the 3,488-kilometer Line of Actual Control (LAC) with China necessitate high-altitude defense readiness, advanced technological integration, and high-velocity battle-space awareness. Rather than relying purely on legacy force deployments, India’s latest defense modernization initiative signals a profound structural shift: integrating autonomous domain dominance, deep surveillance networks, localized defense-industrial manufacturing, and rapid-response tactical infrastructure across key border sectors. Chaired by the Union Ministry of Defence under the Defence Acquisition Council (DAC), this move accords Acceptance of Necessity (AoN) to a spectrum of cutting-edge land, air, and maritime defense platforms. Key Strategic Pillars Driving the $22 Billion Capital Deployment Multi-Domain Capability Overhaul: Directs capital across high-altitude artillery systems, autonomous counter-drone shields, long-range loitering munitions, and specialized naval electronic countermeasures. Indigenous Sourcing Imperative: Targets an ambitious 82% domestic procurement reserve , channeling the vast majority of production mandates toward public sector defense units and domestic technology conglomerates. Accelerated Sanction Velocity: Pushes cumulative military procurement clearances past ₹3.70 trillion ($40+ billion) within a single fiscal year timeframe, reflecting unprecedented administrative agility in clearing defense hardware acquisitions. Asymmetric Technological Balance: Focuses heavily on network-centric warfare tools, real-time aerial sensor integration, counter-UAS platforms, and intelligent target acquisition to neutralize force-asymmetry challenges across rugged Himalayan geography. Detailed Data Breakdown and Fiscal Metrics The newly sanctioned budget framework builds upon India’s expanding national defense capital expenditure allocation. To understand the scale, velocity, and focus of this massive rollout, examine the foundational figures driving this authorization: Total DAC Clearance Approval: ₹2,12,000 Crore ($22.27 Billion USD) dedicated primarily to capital acquisition, advanced tech integration, and border hardware modernization. Cumulative Fiscal Approvals: ₹3,70,000 Crore cleared across recent administrative procurement cycles, marking one of the fastest capital sanction drives in modern Indian defense history. Global Procurement Standing: India accounts for approximately 8.2% of global major arms imports , making it the world’s second-largest defense importer—a posture New Delhi intends to systematically transform via localized procurement mandates. Domestic Defense Sector Allocation: Over ₹1,73,800 Crore (~$18.2 Billion) of the new outlay is reserved explicitly for Indian original equipment manufacturers (OEMs), defense technology innovators, and private engineering firms. Core Impact Areas: Modernization in Focus 1. High-Altitude Surveillance, Tactical UAVs, and Loitering Munitions A substantial portion of the approved capital explicitly targets aerial domain awareness and precision strike capability. Strategic acquisitions focus on long-range Unmanned Aerial Systems (UAS) capable of continuous, all-weather reconnaissance across high-altitude border regions including Eastern Ladakh, Sikkim, and Arunachal Pradesh. These platforms will operate alongside long-range kamikaze drone systems and Integrated Surveillance and Strike Systems, ensuring squad-level visibility coupled with instantaneous real-time strike capabilities. 2. Counter-Drone Shields and Air Defense Systems Recognizing the rapid proliferation of unmanned strike threats and drone swarms in modern theater warfare, New Delhi is deploying multi-layered air defense systems. Approvals cover Very Short-Range Air Defense Systems (VSHORADS) alongside Platform-Based Counter-Unmanned Aerial Systems (C-UAS). These systems combine electronic warfare jamming suites with kinetic interception capabilities to secure forward bases, logistical choke points, and tactical staging areas along sensitive border frontiers. 3. Precision Long-Range Firepower and Tactical Mobility High-altitude standoff experience along mountain corridors has underscored the vital importance of high-mobility heavy firepower. The procurement plan includes Self-Propelled Tracked Gun Systems, High Mobility Vehicles (HMVs) for troop and supply transit across rugged terrain, Gun Shot Response Systems (GSRS) for instantaneous counter-battery detection, and specialized Light Multi-Role Helicopters (LMRH) tailored for high-altitude vertical insertion. 4. Naval Dominance and Maritime Security While land and air boundaries require immediate reinforcement, India continues to secure its maritime flank across the Indian Ocean Region (IOR). The Navy receives capital allocations for Active Offboard Decoy Systems (AODS) and major naval defense platforms, protecting carrier strike groups and surface assets against anti-ship missile threats and submarine tracking. 5. Tactical Weather Intelligence and Border Infrastructure Support Modern high-altitude defense warfare relies on accurate environmental data. The Air Force segment of the capital package incorporates Mobile X-Band Doppler Weather Radars, enabling precision flight planning, artillery trajectory calculations, and missile guidance under dynamic Himalayan atmospheric conditions. Industrial Strategy: Local Manufacturing vs. Global Technology Fusion India’s defense modernization strategy relies on a balanced dual-track model. Under the Make in India and Atmanirbhar Bharat policies, domestic manufacturing receives priority allocation, fostering an ecosystem of domestic defense suppliers. Concurrently, the rapid evolution of modern defense hardware encourages global technology partnerships. International aerospace and defense contractors are engaging in technology transfers, joint design ventures, and co-production agreements covering specialized optics, radar sensors, micro-electronics, and jet propulsion systems. Geopolitical Outlook and Regional Deterrence New Delhi’s approval of $22 billion in military procurement reinforces a long-term strategic principle: border stability is fundamentally linked to unshakeable defensive strength. By directing capital into high-tech ISR, autonomous drone networks, air defense coverage, and high-altitude mobility, India reinforces its operational posture along its northern borders. As these capital clearances transition into signed production contracts and active deployments over the coming quarters, the Indian Armed Forces are set to gain greater technological autonomy, higher battlefield agility, and resilient multi-theater readiness. Team BONC Network October 26, 2026

#IndiaDefense#DefenseModernization#IndianArmedForces
BONC NETWORK
Nvidia’s $12.9B Hugging Face Deal - DOJ Expands Antitrust Inquiry
Industry Report

Nvidia’s $12.9B Hugging Face Deal - DOJ Expands Antitrust Inquiry

Executive Summary Transaction Value: $12.93 billion total transaction value, comprising approximately $11.9 billion in equity/cash value and a $1 billion operational retention fund. Core Investigation Target: The U.S. Department of Justice (DOJ) is investigating whether acquiring the dominant open-source repository gives a single hardware manufacturer total control over the primary distribution pipeline for artificial intelligence software. Broader Regulatory Probe: The Hugging Face acquisition has been formally tied into a multi-year antitrust investigation into semiconductor supply chain dominance, which also targets previous transactions including SchedMD ($2025$), Run:ai, and talent/licensing arrangements with Groq ($20 billion aggregate framework). Target Completion: The acquisition is projected to close in the first half of 2027 , pending antitrust approvals. Federal antitrust regulators at the U.S. Department of Justice have formally expanded an active, multi-pronged anti-monopoly probe into the high-performance computing hardware sector, focusing heavily on Nvidia’s definitive $12.93 billion agreement to acquire Hugging Face. The regulatory scrutiny focuses on platform neutrality, open access, and software distribution across global AI infrastructure. Key Scrutiny Vectors Under Inquiry Control of AI Distribution Hubs: Antitrust regulators are examining whether acquiring the world's largest open-source hub—hosting millions of datasets, open-weight models, and developer tools—creates a single chokehold over developer software distribution networks. Cross-Architecture Hardware Neutrality: Regulatory officials are questioning whether post-acquisition software optimizations could give proprietary accelerator processing units unfair technical advantages over competing processing chips or alternative cloud platforms. Pattern of Infrastructure Consolidation: The DOJ inquiry incorporates the Hugging Face deal into a broader review of hardware and software acquisitions, including supercomputing workload management tool SchedMD, efficiency software creator Run:ai, and high-value technology licensing/hiring deals with Groq. Industry Impact & Platform Guarantees In response to federal inquiries, executive leadership has maintained that Hugging Face will remain an open, platform-neutral hub supporting third-party hardware architectures, competing cloud networks, and open frameworks. While no formal enforcement action or injunction has been filed, regulators continue to solicit feedback from competing hardware developers and cloud providers to determine if platform ownership threatens market competition across the digital supply chain. Industry Impact Analysis: Developers & Cloud Infrastructure The Department of Justice’s probe into Nvidia’s $12.93 billion acquisition of Hugging Face highlights structural shifts across the broader software and hardware supply chains. Below is an examination of how this inquiry and potential acquisition directly affect open-source developers and third-party cloud infrastructure providers. Impact on Open-Source AI Developers Neutrality and Platform Independence: Hugging Face acts as the central hub for open-weight models, hosting over millions of shared datasets, model weights, and application spaces. Developers rely on its vendor-agnostic foundation. The primary concern among open-source builders is whether default optimization layers will subtly favor CUDA-native acceleration over open frameworks. Developer Workflow Integration: Nvidia’s integration could streamline deployment pipelines by embedding specialized libraries directly into standard Hugging Face workflows. While this improves performance out-of-the-box for standard compute setups, developers using non-standard or custom accelerator architectures fear increased integration friction. Preservation of Open Access: Regulators are examining whether free-tier hosting, open model repositories, and public spaces will remain fully subsidized or shift toward monetized, hardware-bound enterprise features over time. Impact on Third-Party Cloud Providers Hyperscaler Competition: Major cloud platforms—such as Amazon Web Services, Google Cloud, and Microsoft Azure—rely heavily on Hugging Face hosted container instances. Ownership by a single hardware manufacturer raises strategic questions about compute-tier neutrality and direct cloud partnership dynamics. Alternative Hardware Providers: Emergent processing unit manufacturers and custom silicon designers face potential distribution bottlenecks if model optimization presets default to established proprietary chip architecture. Deployment Portability: Enterprise cloud architects are increasingly evaluating containerized, multi-repository strategies to prevent vendor lock-in and ensure models can be seamlessly migrated across diverse infrastructure environments. Long-Term Market Implications Federal regulatory oversight serves as a stabilizing force to ensure that commitments to vendor-neutral distribution, open model hosting, and cross-architecture interoperability are enforced throughout the multi-year approval process.

#AI#Antitrust#Semiconductors
BONC NETWORK
Anthropic’s Landmark S-1 Public Filing: Scale, Financial Liabilities, and Mission Governance
Analysis

Anthropic’s Landmark S-1 Public Filing: Scale, Financial Liabilities, and Mission Governance

San Francisco / Global Tech Analysis | October 27, 2026 The registration statement filed by Anthropic —the artificial intelligence research organization and developer behind the Claude model family—has provided the global financial and technology sectors with an unprecedented look into the hyper-scale economics driving frontier AI. Anthropic's S-1 prospectus reveals an operational landscape defined by rapid revenue acceleration, immense noncancelable computing obligations, non-cash equity accounting adjustments, and a specialized corporate governance framework designed to balance commercial expansion with AI safety mandates. As the organization prepares for an initial public offering targeting a valuation between $1.5 trillion and $2 trillion , this analysis breaks down the core structural insights from the filing. 1. Top-Line Acceleration vs. Noncancelable Infrastructure Liabilities The central structural tension highlighted in Anthropic's prospectus is the direct link between enterprise software adoption and long-term capital commitments required to sustain foundation models. Key Qualitative Insights: Explosive Top-Line Trajectory: Demonstrating strong commercial product-market fit, Anthropic reported $16.3 billion in revenue for the first half of the year , representing a fourteen-fold (1,300%+) increase compared to $1.16 billion in the same period the previous year. This growth is primarily driven by enterprise integration of the Claude API suite, agentic developer workflows, and expanding enterprise spending across key corporate cohorts. Long-Term Infrastructure Locking: To support its training and inference requirements, Anthropic disclosed more than $475 billion in compute capacity agreements with multi-year cloud partners. The filing notes that these contracts are overwhelmingly noncancelable , obligating the organization to fixed hardware and energy outlays over extended horizons regardless of future market fluctuations. Capital-Intensive Model Economics: Securing hundreds of billions in infrastructure commitments highlights that competitiveness in frontier AI is directly bound to capital depth, data center access, and power supply allocation. Servicing these fixed obligations requires Anthropic to sustain continuous revenue growth at scale. 2. The Profitability Paradox: Operational Focus vs. Non-Cash Accounting Adjustments Anthropic’s financial disclosures present a distinction between core operational results and total reported net income. Key Qualitative Insights: Accounting Loss Mechanics: The prospectus reported a net loss of $80.7 billion for the first half of the year. The filing clarifies that roughly $72.4 billion of this total stems from non-cash accounting adjustments related to the fair-value remeasurement of convertible instruments and equity obligations as the enterprise valuation rose. These charges represent equity accounting entries rather than direct operational cash burn. Underlying Operational Execution: Anthropic recorded an operating loss of $693 million against $16.3 billion in revenue during the first half. This operational performance indicates that direct serving, unit-level inference costs, and baseline administrative expenses are stabilizing as revenue volume expands. Balance Sheet Liquidity Buffer: To manage capital outlays and maintain operational runway, Anthropic holds $112.4 billion in cash and cash equivalents . This liquidity reserve provides a buffer to cover ongoing compute commitments and support research and development initiatives. 3. Public Offering Architecture, Governance, and Risk Profile The capital structure of the proposed offering and the explicit risk disclosures position Anthropic in a unique category among public market technology listings. Key Qualitative Insights: Landmark Offering Scope: Aiming to raise approximately $100 billion at a targeted public valuation of $1.5 trillion to $2.0 trillion , the offering is designed to fund next-generation compute clusters, custom hardware access, and global enterprise operations. Mission-Oriented Governance: Operating as a Public Benefit Corporation (PBC), Anthropic incorporates unusual governance arrangements that prioritize safe and aligned AI development over short-term financial optimization. These mechanisms leave ordinary public equity holders with limited voting control over strategic and safety policies, requiring public investors to align with management’s long-term governance mission. Explicit Disclosure of Systemic Threats: The prospectus details risks associated with frontier AI deployment, including potential vulnerabilities related to automated cyber exploits, biological information synthesis, and alignment challenges in autonomous agentic systems. The filing also highlights external dependencies such as semiconductor export controls, regional regulatory divergence, and power grid infrastructure availability. Conclusion: A Benchmark for Frontier AI Capital Markets Anthropic’s S-1 filing demonstrates the scale and structural complexity of modern AI development. The prospectus presents an enterprise achieving rapid revenue growth alongside long-term infrastructure commitments and non-cash equity accounting adjustments. As Anthropic moves toward its public debut with specialized governance structures intact, its financial execution will serve as a primary indicator for how public equity markets price hyper-growth, long-term capital liabilities, and technological governance.

#Anthropic#ClaudeAI#TickerAN
BONC NETWORK
Democratic and Trustworthy Technology Forum | Taipei | October 27, 2026
Industry Report

Democratic and Trustworthy Technology Forum | Taipei | October 27, 2026

Fortifying Democratic Tech Supply Chains: Key Outcomes from the 2026 Democratic and Trustworthy Technology Forum As advanced technologies reshape global geopolitics, democratic nations are prioritizing secure, transparent, and resilient supply lines. On October 27, 2026, Taiwan’s Ministry of Foreign Affairs (MOFA) co-hosted the Democratic and Trustworthy Technology Forum alongside the Formosa Club in Taipei. The high-level event brought together nearly 50 parliamentarians and security experts representing 19 European nations alongside Taiwanese decision-makers. Discussions focused on joint initiatives across artificial intelligence (AI), uncrewed aerial systems (drones), and the construction of trusted, non-authoritarian hardware ecosystems. Event at a Glance Event Title: Democratic and Trustworthy Technology Forum Date: October 27, 2026 Location: Taipei, Taiwan Co-Hosts: Ministry of Foreign Affairs of Taiwan & The Formosa Club Delegation Composition: European Parliament representatives, national lawmakers from 19 European countries, and leading Taiwanese technology and security strategists. Key Focus Areas & Core Outcomes 1. Trustworthy Artificial Intelligence Governance Participants emphasized that the advancement of AI demands strict compliance with democratic values, transparent algorithms, and robust data protection standards. Ethics and Standard-Setting: Establishing shared operational guidelines to ensure AI deployment remains transparent, traceable, and protected against algorithmic manipulation or unauthorized access. Industrial & Robotic Cyber Defense: Collaborating on hardware security architecture to shield automated manufacturing, industrial robotics, and critical public infrastructure from foreign cyber exploits. 2. Autonomous Drone Systems and Critical Infrastructure Protection Unmanned aerial and underwater assets emerged as critical strategic priorities for both commercial resilience and security. Joint Technical Innovation: Attendees advocated for accelerated research and co-production of commercial and security drone systems, ensuring software and components originate from trusted partners. Subsea Communications Vulnerabilities: Panels highlighted the security of undersea fiber-optic communication cables as vital to international digital stability. Delegates recommended joint deployment of unmanned underwater vehicles (UUVs) to monitor and protect subsea transmission cables. 3. Resilient "Non-Red" Supply Chains Given Taiwan’s central role in global semiconductor fabrication and advanced technology production, delegates focused on protecting critical supply networks. Decoupling from High-Risk Suppliers: Creating "non-red" technology corridors that eliminate dependency on vendors operating under non-democratic regulatory frameworks. Strengthening Europe–Taiwan Synergies: Aligning Taiwan's specialized microelectronics and hardware design sector with Europe’s strategic autonomy objectives to insulate international trade against geopolitical disruptions. Strategic Alignment Delegates affirmed that technological security directly reinforces national sovereignty. European participants highlighted Taiwan's indispensable role as a high-tech manufacturing partner, emphasizing that establishing shared, secure standards for critical technologies ensures economic stability and defends shared democratic values worldwide. Over 50 European Parliament Members Visit Taiwan This news video reports directly on the October 27 forum in Taipei, covering the delegation of European lawmakers discussing joint AI and drone supply chain initiatives with Taiwanese representatives. As critical technologies redefine global geopolitics, Taiwan’s MOFA and the Formosa Club convened European lawmakers and security leaders in Taipei to forge resilient, non-authoritarian supply chains for AI and unmanned systems.

#TrustworthyTech2026#DemocraticTechForum#BONCNetwork
BONC NETWORK
Japan Economic Performance: Late October 2026 Review
Industry Report

Japan Economic Performance: Late October 2026 Review

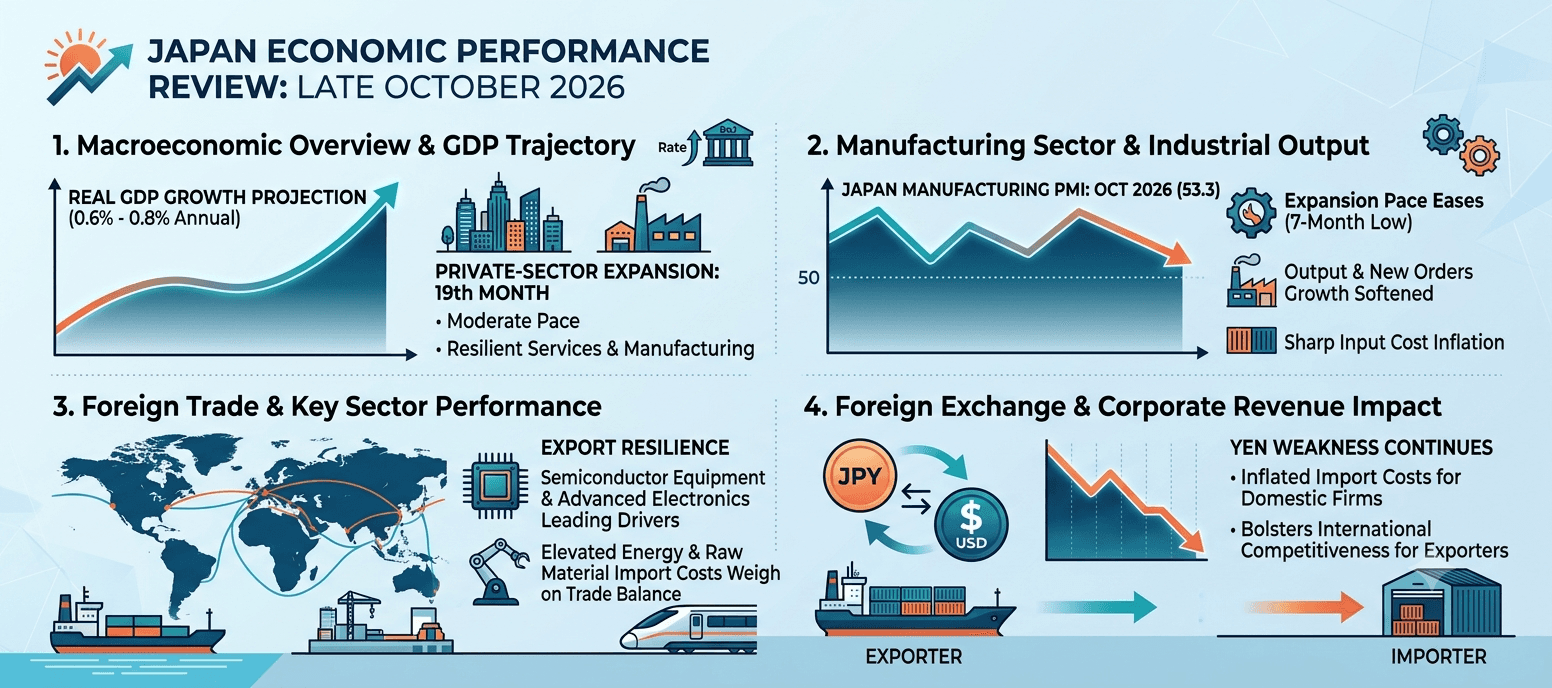
1. Macroeconomic Overview & GDP Trajectory Growth Stability & Projections: Real GDP growth is maintaining a moderate pace, projected within the 0.6 percent to 0.8 percent annual range. Private-sector expansion continued for its 19th consecutive month, anchored by resilient activity across both services and manufacturing. Monetary Policy Landscape & Bank of Japan: With core inflation persisting above target thresholds and wage increases taking firm root across smaller regional and national enterprises, the Bank of Japan maintains a hawkish bias, closely monitoring incoming data for potential interest rate adjustments heading toward year-end. Domestic Cost Pressures: Surging input costs and imported commodity pressures continue to challenge domestic purchasing power, prompting cautious consumer spending patterns while employment growth shows moderate gains. 2. Manufacturing Sector & Industrial Output Purchasing Managers Index (PMI) Trends: S&P Global data for late October 2026 shows the Japan Manufacturing PMI easing to 53.3 from 54.1 in September, marking a seven-month low in expansion pace while remaining comfortably above the crucial 50-point threshold. Output & New Orders: Growth in factory output and new order inflows slowed to their softest rates since March, driven by moderating domestic demand and selective global client caution. Input Costs & Supply Chains: Manufacturers experienced sharp input cost inflation and extended supplier delivery times, leading firms to accelerate safety stock building and push inventory accumulation to near four-year highs. 3. Foreign Trade & Key Sector Performance Export Resilience: Foreign sales continue to provide vital support to the corporate sector, propelled heavily by robust global demand for high-end technology, industrial automation, and artificial intelligence infrastructure. Technology & Automotive Sectors: Semiconductor equipment and advanced electronics remain leading export growth drivers, while automotive manufacturers navigate mixed international volumes alongside high-margin pricing strategies in Western markets. Import Costs & Trade Balance: Elevated energy and raw material import costs—compounded by regional transport disruptions—continue to weigh on the national trade balance, resulting in persistent import bill expansions and narrow trade deficits. 4. Foreign Exchange & Corporate Revenue Impact Yen Valuation & Exchange Dynamics: The Japanese yen continues to trade within a weaker band against the US dollar, creating distinct pressures across different segments of the economy. Exporter Margins vs. Import Bills: While the weaker currency significantly inflates raw material, fuel, and energy import costs for domestic-focused enterprises, it bolsters international price competitiveness for major Japanese industrial exporters, effectively cushioning corporate revenues and net earnings. As Japan navigates the final stretch of October 2026, balancing technology-driven export resilience against mounting import costs and imminent monetary policy shifts, proactive strategic adaptation remains paramount. Organizations must closely monitor currency fluctuations, manage supply chain pressures, and prepare for evolving interest rate environments to secure long-term operational stability.

#JapanEconomy#GlobalTrade#BankOfJapan
BONC NETWORK
South Africa Financial Markets in October 2026: Key Trends, Risks and Business Impact
Market Study

South Africa Financial Markets in October 2026: Key Trends, Risks and Business Impact

South Africa’s financial markets are navigating a challenging combination of rising energy costs, inflation uncertainty, currency fluctuations and changing investor expectations. At the same time, developments in government finances have offered some encouragement, creating a mixed outlook for businesses, consumers and investors. October 2026 is an important period for understanding how international events affect South Africa’s domestic economy. Fuel prices, interest rates, the rand, commodity markets and government borrowing all influence the cost of doing business and the direction of financial markets. This original article examines these developments in an editorial format, with relevant images for use in a business publication or on BONC Network. 1. South Africa’s financial market: a mixed economic outlook South Africa’s economy is being shaped by two competing forces. Improved government revenue expectations and efforts to manage public debt could strengthen investor confidence. However, higher fuel costs, inflation risks and relatively modest economic growth continue to challenge businesses and households. Financial markets respond not only to current economic conditions but also to expectations about what may happen next. Investors are assessing whether inflation will remain elevated, whether the currency can stabilise and whether government measures will translate into sustainable economic improvements. For businesses, the immediate priority is managing costs and cash flow while remaining prepared for changes in demand, borrowing costs and international trade conditions. 2. Inflation and rising fuel prices Fuel prices are an important channel through which international economic developments affect South African consumers and companies. South Africa relies heavily on imported petroleum products, making domestic fuel costs sensitive to global oil prices and the exchange rate. When fuel becomes more expensive, the consequences extend beyond motorists to freight operators, food distributors, manufacturers and retailers. Higher transportation costs can increase the price of everyday goods. Households may respond by reducing discretionary purchases, while businesses must decide whether to absorb additional expenses or pass some of them on to customers. Consumer inflation reached 4.5% year-on-year in September 2026, according to reporting published in October. Higher fuel costs could add further pressure to the next inflation reading. For smaller businesses, the challenge is particularly significant: operating expenses may rise faster than sales, reducing already limited profit margins. 3. Interest rates and their effect on businesses Interest rates influence the cost of borrowing, household spending, business investment and financial-market valuations. The South African Reserve Bank’s October monetary policy review reported a policy rate of 7.25% following a cumulative 50-basis-point increase during the review period. The bank also projected economic growth of approximately 1.2% for 2026. The central bank faces a difficult balance. Higher interest rates can help contain inflation, but they also increase the cost of financing homes, vehicles, inventory and business expansion. For businesses considering new equipment, additional employees or expansion into new markets, financing costs become an important part of investment decisions. Consumers facing higher loan repayments may have less money available for shopping, travel and other services. If inflation begins to ease sustainably, the outlook for future rate reductions could improve. If fuel costs continue to feed into broader prices, borrowing conditions may remain restrictive for longer. 4. The rand and international investor confidence The rand is a key indicator of how domestic and international developments interact. Its value can change in response to US interest-rate expectations, global investor sentiment, commodity prices and political or geopolitical uncertainty. A weaker rand makes imported fuel, machinery, electronics and other foreign-currency-priced products more expensive. Businesses that depend on imported materials may experience increased costs, while exporters earning foreign currency can receive more rand for their overseas revenue. A stronger rand can reduce some import costs and ease inflation pressure, although it may reduce the local-currency value of foreign earnings for exporters. Businesses trading between South Africa and India should pay particular attention to the rand–rupee exchange rate. Currency movements can affect purchasing costs, contract pricing, margins and the competitiveness of products in both markets. 5. How the Johannesburg stock market is being affected The Johannesburg Stock Exchange (JSE) reflects a wide range of businesses, so the same economic developments can have very different effects across sectors. Banking and financial services: Higher interest rates may support some lending margins, but they can also increase repayment pressure and weaken demand for credit. Banks must balance potential revenue benefits against credit risks and slower economic activity. Mining and commodities: Companies producing gold, platinum-group metals and other resources may benefit from favourable commodity prices. However, profitability also depends on operating expenses, production volumes, electricity supply, transport infrastructure and global demand. Retail and consumer businesses: Rising fuel and borrowing costs can reduce household purchasing power. Retailers may need to compete more strongly on price, convenience and value to protect sales. Manufacturing and logistics: Higher fuel, freight and imported-input costs can squeeze margins. Businesses that cannot easily adjust prices may face particular difficulties. Property and income-focused investments: Changes in interest rates and bond yields can affect property valuations, financing expenses and the relative appeal of income-generating investments. The key point is that a market-wide recovery does not mean every company is performing well. Investors need to distinguish between sector trends and the financial position of individual businesses. 6. Government finances and investor confidence South Africa’s mid-term budget update on 21 October 2026 provided an important signal for the financial community. The government projected that revenue for the 2026/27 financial year would be R17.1 billion higher than forecast in February. The government is also aiming to narrow the budget deficit over the medium term and stabilise public debt. Stronger revenue and credible fiscal management can help reassure investors about the government’s ability to meet its financial obligations. If borrowing requirements become more manageable, government bonds could benefit, while improved confidence may support investment over time. However, higher revenue alone does not resolve the country’s longer-term economic challenges. Debt-servicing costs, unemployment, infrastructure constraints and weak growth remain important concerns. The sustainability of the improvement will depend on whether revenue gains continue, spending remains disciplined and the economy develops a stronger capacity to generate jobs and investment. 7. International oil prices and global trade South Africa’s financial outlook is closely connected to international trade and energy markets. Disruptions to oil supplies, geopolitical tensions and changes in global demand can affect the cost of imports and the earnings of exporters. Higher oil prices increase the cost of transporting goods and operating fuel-intensive businesses. If the rand weakens at the same time, the impact on local costs can be even greater. International trade conditions also create opportunities. Businesses that export competitively priced goods may benefit from overseas demand, while importers may need to renegotiate supplier terms or revise pricing strategies. For companies involved in South Africa–India trade, three areas deserve particular attention: exchange-rate exposure, freight costs and the timing of purchase orders. Clear contract terms and realistic financial planning can help reduce uncertainty. 8. Which sectors face the greatest pressure, and where could opportunities emerge? The October environment creates different risks and opportunities across the economy. Transport and logistics: Fuel-price increases can raise delivery expenses and reduce margins. Consumer goods and retail: Households may focus on essential products and become more price-sensitive. Manufacturing: Higher energy, freight and imported-material costs can make production more expensive. Mining and commodity exports: Selected producers may benefit from favourable international prices, depending on their costs and production levels. Financial services: Banks, bond investors and other financial institutions may see opportunities, but outcomes will depend on inflation, credit quality and market expectations. Import and export businesses: Companies that manage exchange-rate risk and supply-chain costs effectively may be better positioned to remain competitive. These are potential economic effects, not guarantees of investment performance. Actual results depend on individual businesses, market prices and future developments. 9. What should businesses and investors watch in November? The next phase of the market outlook will depend on several developments. The Reserve Bank’s interest-rate decision: Investors will assess whether inflation risks justify further tightening or whether rates can remain unchanged. The next inflation figures: These will help show how much of the fuel-price shock is passing into the wider economy. Rand and oil-price movements: Currency stability and energy costs will influence imported inflation, corporate expenses and trade competitiveness. Government budget implementation: Investors will look for evidence that stronger revenue expectations translate into more sustainable public finances. Corporate earnings and business activity: Company results will help establish whether businesses are managing higher costs or experiencing weaker demand. For businesses, the practical response is to review cash-flow forecasts, monitor supplier prices, manage currency exposure and avoid assuming that recent market movements will continue in the same direction. 10. Conclusion: a market balancing resilience and uncertainty South Africa’s financial environment in October 2026 reflects both encouraging developments and continuing economic pressures. Improved government revenue expectations provide a positive signal, but rising fuel costs, inflation uncertainty, borrowing expenses and modest growth remain important challenges. The direction of the market over the coming months will depend on whether inflation moderates, the rand becomes more stable, international energy costs ease and the government maintains credible fiscal management. For companies, disciplined cost management and careful financial planning will be essential. For investors, understanding differences between sectors and evaluating individual businesses will be more useful than relying on a single market headline. The central message is clear: South Africa’s financial resilience will depend not only on currency movements or stock-market performance, but also on its ability to control inflation, strengthen public finances, improve business conditions and generate sustainable economic growth. Sources and editorial note The article is original editorial writing, informed by publicly reported economic developments. For factual verification and further reading, consult: South African Reserve Bank — Official website and monetary policy publications . Reuters — International financial and economic reporting . National Treasury of South Africa — Budget documents and fiscal policy updates . Johannesburg Stock Exchange — Market information and listed-company resources . Publication note: The text has been written from scratch and does not intentionally reproduce third-party article passages. Names of institutions are used for factual identification. This is not a guarantee of legal clearance, and market figures should be checked against official releases before publication.

#SouthAfrica#FinancialMarkets#SouthAfricanEconomy
BONC NETWORK
The Agentic Economy: Finance and Accounting Complete the Great Migration in Q3 2026
Industry Report

The Agentic Economy: Finance and Accounting Complete the Great Migration in Q3 2026

By the close of the third quarter of 2026, the global corporate ecosystem finalized a foundational migration. The experimental phase of Generative AI ended, replaced by universal integration within the Finance and Accounting (F&A) function. If the early 20s were characterized by fragmented "island automation" using basic robots, Q3 2026 marked the maturation of Agentic Finance—where autonomous AI agents operate directly inside ERP environments like SAP S/4HANA, Oracle Cloud ERP, and Workday, managing the full transaction lifecycle without prerequisite human intervention. ​This evolution is fundamentally reshaping shared business models and Managed Business Services (MBS), driven by a corporate obsession with structural cost optimization and the pursuit of "zero-latency financial books.." ​The Anatomy of Transformation: Major Players and Strategic Shifts ​The Global Business Services (GBS) model, formerly rooted in low-cost headcount arbitrage, completed its multi-year pivot toward technological orchestration. Managed Business Services and BPO leaders—such as Genpact, Accenture, Deloitte, EXL Service, and Helpware—have fundamentally restructured their service delivery models. ​To remain competitive, these outsourcing giants have largely abandoned traditional full-time equivalent (FTE) billing models. In Q3 2026, MBS contracts are now structured entirely around "Outcome-as-a-Service." Enterprise clients no longer purchase headcount; they purchase guaranteed operational outcomes, such as a standardized cost per closed period, a static accuracy percentage, or a metric linked to cash flow optimization. To maintain their own operational margins under these outcome-linked contracts, service providers have automated up to 85% of transactional workflows. ​Data from late 2026 indicates that 65% of global finance hubs have now institutionalized centralized AI governance bodies to supervise these agentic workflows, moving the role of finance teams from "data processors" to "governors of automated systems." ​The Financial Realities: Compressing Costs and Eliminating Errors ​The financial impact of this agentic migration is visible across enterprise balance sheets. The pursuit of cost optimization through automation is no longer theoretical; it is realized across major corporate finance departments. ​In transactional areas, the data shows a dramatic drop in operational overhead: ​Accounts Payable (AP) Efficiency: Across global enterprises, the fully loaded cost of processing an invoice in Accounts Payable has fallen from a manual baseline of roughly $13.50 down to a stabilized average of $2.98. AP agents operating within platforms like BlackLine and Workiva read invoices, auto-match purchase orders, calculate tax jurisdictions, and execute payments, routing only severe anomalies to human controllers. ​Accuracy & Error Reduction: While manual data entry historically carried a 1% to 5% error rate—creating substantial downstream reconciliation workloads—AI agent accuracy in Q3 2026 has stabilized above 99.5% for standard transactional posting. ​Continuous Compliance Audit: Traditional audit sampling (reviewing 10% to 15% of records) has been replaced by 100% continuous compliance monitoring. Secondary AI auditing agents evaluate every transaction in real-time against statutory frameworks (such as IFRS 16/17 and ASC 842), reducing financial reporting compliance errors by 78%. ​Corporate Milestones: Achieving the Continuous Close ​Several major technology and cloud giants—including Microsoft, Amazon, Cisco, and Oracle—have set distinct benchmarks that define the new F&A landscape by using embedded AI engines to execute real-time intercompany eliminations and automated multi-currency reconciliations throughout the month. ​The Continuous Close: By automating complex reconciliations in real time throughout the operating period, the traditional "month-end crunch" has largely disappeared. The standard corporate close window has compressed from 8–10 business days down to 3–5 days—a 30% to 50% speed improvement across major global entities. ​Advisory Capacity Expansion: F&A teams leveraging agentic workflows report reallocating ~8.5% of total working hours away from routine production and data extraction toward high-value strategic advisory, scenario planning, and capital allocation modeling. This shift effectively unlocks approximately 7 weeks of additional advisory capacity per employee annually, directly enhancing executive decision-making.

#​#AIInFinance#FinanceTransformation
BONC NETWORK
Top 10 Pharma Quarterly Revenue (Global & India)
Research

Top 10 Pharma Quarterly Revenue (Global & India)

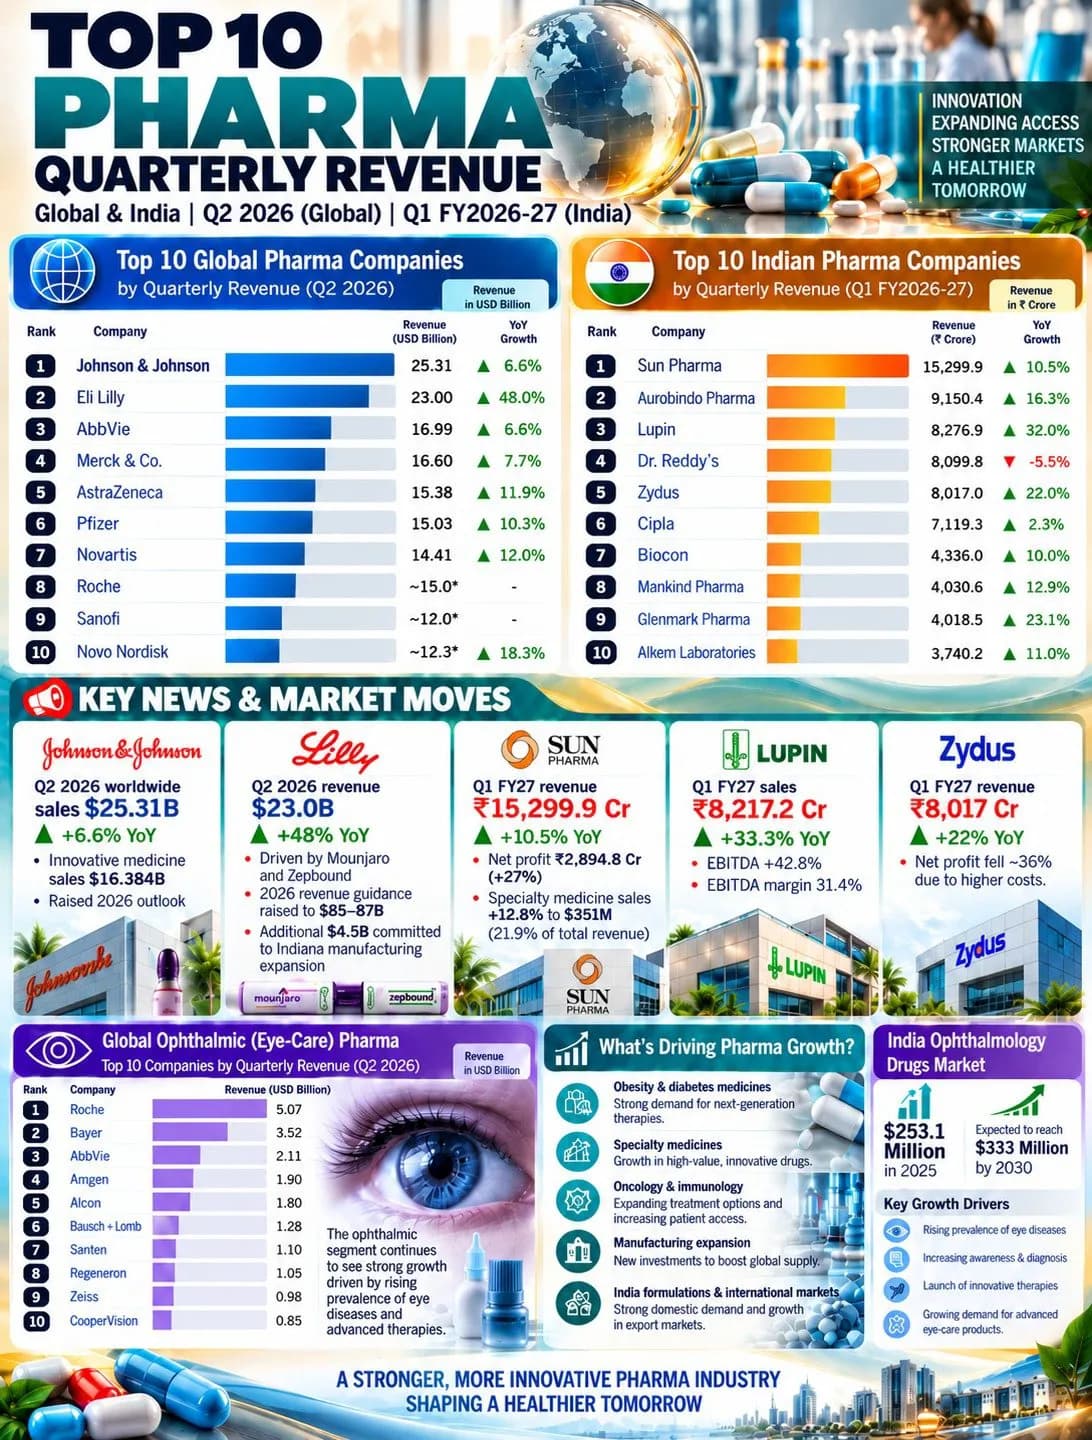
1. Global Market Leadership (Q2 2026) ​Top 3 Global Players: Johnson & Johnson leads with $25.31B (+6.6% YoY), followed closely by Eli Lilly at $23.00B (+48.0% YoY) and AbbVie at $16.99B (+6.6% YoY). ​Massive Growth Drivers: Eli Lilly surged +48% YoY, driven by strong demand for obesity and diabetes treatments like Mounjaro and Zepbound. Eli Lilly also raised its 2026 revenue guidance to $85B–$87B. ​2. Indian Pharma Landscape (Q1 FY2026–27) ​Top Performers: Sun Pharma leads the Indian market with ₹15,299.9 Cr (+10.5% YoY), followed by Aurobindo Pharma at ₹9,150.4 Cr (+16.3% YoY) and Lupin at ₹8,276.9 Cr (+32.0% YoY). ​Profitability Highlights: ​Sun Pharma: Net profit surged to ₹2,894.8 Cr (+27% YoY), with specialty medicine sales reaching $351M (21.9% of total revenue). ​Lupin: Recorded a +33.3% YoY sales surge with EBITDA up +42.8% (31.4% EBITDA margin). ​Zydus: Grew revenue by +22% YoY to ₹8,017 Cr, though net profit fell ~36% due to higher operational costs. ​3. Focus Segment: Ophthalmic (Eye-Care) Market ​Global Leaders: Roche leads global ophthalmic revenue at $5.07B, followed by Bayer ($3.52B) and AbbVie ($2.11B). ​India Growth Outlook: The Indian ophthalmic drugs market is projected to expand from $253.1M in 2025 to $333M by 2030. ​Growth Drivers: Driven by higher eye disease prevalence, increased diagnosis/awareness, and rapid adoption of innovative therapies. ​4. Key Strategic Growth Drivers Across the Industry ​Metabolic Therapies: High demand for obesity and diabetes care globally. ​Specialty & Oncology: Specialty medicines and oncology/immunology expansion are driving higher margins. ​Supply Chain & Infrastructure: Heavy investments in global manufacturing expansion (e.g., Lilly’s $4.5B Indiana expansion commitment). ​Domestic & Export Strength: Balanced growth across Indian domestic formulations and key international markets.

#globalpharma#boncnetwork#india
BONC NETWORK