1. The 40% Club (Macro Dominance):
The US ($32.64T) and China ($21.55T) command nearly 40% of the entire nominal global GDP, representing two vastly different demographic and economic models.2. The European Industrial Shift:
Germany ($5.47T, Rank #3) maintains its upper hand over Japan ($4.34T, Rank #4) driven by stable industrial output and currency realignments heading into late 2026.3. India's Ascent & Demographic Dividend:
With a population of 1.48 Billion and nominal GDP hitting $4.06 Trillion (Rank #6), India represents the world's most critical growth headroom with immense per-capita expansion potential.4. High-Efficiency Micro-Economies:
Nations with compact populations like Ireland ($127K+), Switzerland ($124K+), Norway ($115K+), and Singapore ($109K+) continue to shatter per-capita GDP ceilings.5. Regional Diversification Powerhouses:
Emerging regional pillars like Brazil (#10), Mexico (#13), Saudi Arabia (#19), and the UAE (#29) are reshaping global trade routes through nearshoring and resource optimization.
"How is your region adapting to these 2026 economic shifts? Are you betting on high-efficiency micro-nations or massive demographic growth engines? Drop your thoughts below and #BONCIt on the network!"
The $100T+ Reality Check: Top 30 World Economies vs. Population (Nov 2026)
Industry ReportBy BONC NETWORK · 10 Nov 2026
#GlobalEconomy#WorldEconomies#GDP2026#MacroEconomics#EconomicTrends#GlobalDemographics#MarketIntelligence#FutureOfWork#InternationalTrade#EconomicGrowth#boncnetwork#boncit
Comments (1)
P
Pooja Sharma
2 days agoAmazing data points have being factored in. 2 pager but clear message can be driven out.
More from BONC NETWORK

Industry Report
Mitsui Chemicals–JSR Mega Deal: A ¥1.84 Trillion Bet on the Future of Semiconductor Manufacturing
Beyond Chemicals and Corporate Expansion: How a Landmark Acquisition Could Reshape Japan's Position in the Global Semiconductor and AI Supply Chain. A Landmark Acquisition With Global Implications Japan's chemical and semiconductor industries are entering a significant phase of strategic transformation, as Mitsui Chemicals has agreed to acquire JSR Corporation in a transaction valued at approximately ¥1.84 trillion (around US$11.6 billion). Announced on November 9, 2026, the acquisition represents one of the largest transactions in Japan's chemical industry and signals a renewed effort to strengthen the country's position in the increasingly competitive global semiconductor materials market. The transaction involves Mitsui Chemicals and the Development Bank of Japan (DBJ) acquiring JSR from investment funds managed by JIC Capital, a subsidiary of the state-backed Japan Investment Corporation (JIC). While the headline value is substantial, the significance of this transaction extends well beyond its financial scale. It reflects a broader industrial strategy: securing advanced materials technologies, strengthening domestic manufacturing capabilities, accelerating research and development, and positioning Japanese companies to benefit from the next generation of semiconductor production. With artificial intelligence, high-performance computing, data centres and advanced electronics driving demand for increasingly sophisticated chips, the materials used to manufacture semiconductors have become strategically important. This acquisition could therefore represent a major development not only for the companies involved but also for Japan's long-term industrial competitiveness. Understanding the ¥1.84 Trillion Transaction The announced transaction is valued at approximately ¥1.84 trillion, equivalent to around US$11.6 billion. Mitsui Chemicals has entered into a share purchase agreement to acquire JSR's shares alongside the Development Bank of Japan. The transaction includes an equity value of approximately ¥1.3921 trillion, which includes DBJ's planned ¥200 billion investment, alongside approximately ¥447.9 billion in interest-bearing debt and other items. Under the proposed ownership structure, Mitsui Chemicals is expected to hold 100% of JSR's voting rights following completion. DBJ's investment will ultimately be represented through non-voting preferred shares. The acquisition is planned to be financed through a ¥1.64 trillion bridge loan from Mitsui Chemicals' principal financial institutions, together with DBJ's ¥200 billion investment. The final consideration remains subject to adjustments at closing. The agreement was signed on November 9, 2026. Completion is currently targeted for the second half of the fiscal year ending March 2028, subject to the required competition-law and foreign-investment approvals and other conditions. This distinction is important: the companies have signed an acquisition agreement, but ownership has not yet formally transferred. Why JSR Is Such an Important Acquisition Target To understand the strategic value of this deal, it is necessary to understand what JSR brings to the semiconductor industry. Founded in 1957, JSR has developed a strong international presence in advanced materials, particularly in products used in semiconductor manufacturing. One of its most strategically important businesses is semiconductor photoresists. Photoresists are light-sensitive chemical materials used in the semiconductor lithography process. During chip manufacturing, these materials help transfer extremely intricate circuit patterns onto silicon wafers. As semiconductor manufacturers move towards increasingly smaller and more sophisticated chip architectures, the precision, performance and reliability of photoresist materials become critical. JSR operates in this specialised segment, supplying materials that support advanced semiconductor production processes. Its broader portfolio also includes display-related and optical materials, alongside plastics and other specialised products. The company's technological expertise, customer relationships, research capabilities and international market presence make it a strategically valuable addition to Mitsui Chemicals. In a semiconductor ecosystem where manufacturing performance depends not only on equipment and chip design but also on highly specialised materials, JSR offers capabilities that are difficult to replicate quickly. The Semiconductor Industry: Why Timing Matters The global semiconductor industry is undergoing a fundamental transformation. Artificial intelligence applications, cloud computing, autonomous technologies, high-performance computing, smartphones, industrial automation and advanced communication systems are increasing the demand for more powerful and efficient semiconductor devices. The expansion of AI infrastructure has particularly increased attention on advanced chips, high-bandwidth memory, sophisticated packaging technologies and next-generation manufacturing processes. However, producing advanced semiconductors requires more than sophisticated fabrication equipment. It depends on an interconnected ecosystem involving: Semiconductor manufacturing equipment. Advanced lithography technologies. Photoresists and specialty chemicals. Silicon wafers and photomasks. Electronic-grade materials. Advanced packaging materials. Research, testing and quality-control capabilities. This is where JSR becomes strategically important. The company operates in a specialised materials segment that directly supports the manufacturing processes used by leading semiconductor producers. By bringing JSR into its group, Mitsui Chemicals aims to strengthen its exposure to a market that is becoming increasingly important to the global technology industry. The transaction also reflects an important shift in industrial strategy: companies are increasingly competing not just to manufacture finished products but to secure critical technologies and materials that support the entire production ecosystem. Mitsui Chemicals' Strategic Vision: Combining Complementary Technologies The acquisition is closely connected to Mitsui Chemicals' long-term business transformation strategy, known as VISION 2030. The company has been working to strengthen its higher-value specialty chemicals businesses while reviewing its broader business portfolio. JSR is expected to become a core component of Mitsui Chemicals' Information and Communications Technology (ICT) Solutions business. The strategic opportunity lies in combining complementary product portfolios. In semiconductor front-end manufacturing, JSR's advanced photoresists can complement Mitsui Chemicals' photomask-protection materials, including its MITSUI PELLICLE™ products. In back-end semiconductor processes, JSR's thick-film resist capabilities can complement Mitsui Chemicals' ICROS™ tape products and other materials used in advanced packaging applications. This combination could allow the companies to offer a broader range of solutions to semiconductor manufacturers. Instead of approaching customers with individual materials, the enlarged group could develop more integrated product offerings across multiple stages of semiconductor production. The intended benefits include: Stronger research and development capabilities. Broader semiconductor material portfolios. Improved global customer engagement. Greater opportunities for joint product development. Enhanced manufacturing and supply capabilities. Better positioning in advanced semiconductor applications. Mitsui Chemicals has identified approximately ¥40 billion in additional annual profit by fiscal 2035 as a target from growth and synergy opportunities associated with the transaction. However, achieving this target will depend on successful integration, market conditions, customer demand and the ability to translate technological advantages into commercial growth. Japan's Semiconductor Ambitions: A Bigger Industrial Picture The acquisition should also be viewed within the wider context of Japan's semiconductor strategy. Japan has historically played an important role in the global semiconductor supply chain, particularly in semiconductor equipment, specialty chemicals, materials, silicon wafers and precision manufacturing technologies. Although the country has faced greater competition in semiconductor fabrication over the years, its position in critical upstream materials remains strategically significant. Companies such as JSR and other Japanese specialty materials producers support semiconductor manufacturers across different regions. The acquisition could strengthen Japan's ability to consolidate important technologies and create a more competitive domestic semiconductor materials platform. It also reflects the growing importance of supply-chain resilience. Governments and industrial companies increasingly recognise that access to advanced materials and manufacturing technologies is essential to economic security and technological independence. For Japan, strengthening its semiconductor materials ecosystem is therefore both an industrial opportunity and a strategic priority. The proposed acquisition could help establish a stronger Japanese supplier with broader capabilities, greater research resources and an enhanced international presence. The Financial Challenge: A Major Opportunity With a Significant Debt Burden While the strategic rationale is compelling, the financial structure of the transaction deserves close attention. The acquisition is substantially debt-funded. Mitsui Chemicals plans to raise approximately ¥1.64 trillion through bridge financing, while DBJ will contribute ¥200 billion. The company has acknowledged that its net debt-to-EBITDA multiple is expected to temporarily exceed four times following completion. This represents a significant financial commitment and introduces additional pressure on the company's balance sheet. The challenge will be to ensure that the acquisition generates sufficient operating cash flow and business growth to justify the capital deployed. Mitsui Chemicals will also need to manage refinancing, integration expenditure, investment requirements and the financial performance of its existing businesses. The company has outlined plans to transition from bridge financing towards more permanent funding arrangements and restore its financial position. The transaction therefore carries two distinct dimensions. On one side, it offers an opportunity to establish a stronger position in a strategically important technology market. On the other, it introduces financial leverage that must be carefully managed over the coming years. The success of this acquisition will depend on whether the anticipated business benefits can translate into sustainable profitability without placing excessive pressure on the company's financial stability. Portfolio Transformation: More Than an Acquisition Another important aspect of the announcement is Mitsui Chemicals' wider portfolio restructuring. The company is reviewing the structure of its Basic & Green Materials business and has expanded the scope of its proposed separation to include Mobility Solutions. The broader objective is to create a more focused business structure and improve the competitiveness of its different operating segments. The acquisition of JSR complements this direction by increasing Mitsui Chemicals' exposure to specialty chemicals and high-value semiconductor materials. JSR has also been reviewing its Life Sciences operations, which have been treated as non-core within its portfolio strategy. Potential divestments and restructuring initiatives could allow the enlarged group to concentrate resources on businesses with stronger strategic alignment and growth potential. This suggests that Mitsui Chemicals is not simply purchasing another company to increase its size. It is attempting to reshape its business portfolio around areas where advanced technologies, specialised materials and long-term industrial demand could create stronger competitive advantages. What Could This Mean for the Global Semiconductor Supply Chain? The acquisition could have implications beyond Japan. Semiconductor production is highly interconnected, with major manufacturers and technology companies operating across the United States, Europe, Taiwan, South Korea, Japan and other markets. Materials suppliers play an essential role in maintaining production quality, process consistency and manufacturing efficiency. By combining Mitsui Chemicals' existing materials portfolio with JSR's expertise, the enlarged organisation could become a more significant supplier to semiconductor manufacturers internationally. Potential developments include: 1. Stronger competition among materials suppliers A broader product portfolio could improve the group's competitive position against other international semiconductor materials companies. 2. Greater investment in next-generation materials Combining research teams and technological resources could accelerate the development of advanced photoresists and other materials required for future chip manufacturing. 3. More integrated customer solutions Semiconductor manufacturers may benefit from a supplier capable of addressing a wider range of material requirements across front-end and back-end production processes. 4. Stronger Japanese industrial positioning The deal could reinforce Japan's role as an important source of advanced semiconductor manufacturing materials. 5. Potential changes in industry consolidation The transaction may encourage further strategic partnerships, investments and consolidation within the global semiconductor materials sector. Nevertheless, the actual impact will depend on how successfully the combined businesses integrate their operations and maintain customer confidence. Risks and Challenges That Cannot Be Overlooked Despite the strategic advantages, several challenges remain. First, the scale of the financing introduces considerable balance-sheet risk. A debt-heavy acquisition requires careful financial management, especially if semiconductor demand experiences a cyclical slowdown. Second, technological integration will be important. Combining research capabilities, production processes and customer relationships across two established organisations can take time. Third, the semiconductor materials market is highly specialised. Product qualification, reliability testing and customer approval processes can be lengthy. New commercial opportunities may therefore take time to translate into revenue. Fourth, global competition remains intense. Established international materials companies continue investing in research, innovation and manufacturing capabilities. Finally, the transaction remains subject to regulatory clearances. Competition-law and foreign-investment reviews could influence the timing or conditions of completion. Investors will therefore need to evaluate the acquisition not only through its strategic ambitions but also through its execution, financing and long-term financial returns. What Investors and the Industry Should Watch Next Several developments will determine how this transaction progresses. Regulatory approvals and the final acquisition timetable. The transition from bridge financing to permanent funding. Mitsui Chemicals' ability to manage its post-acquisition debt levels. Progress towards the targeted ¥40 billion annual incremental profit by fiscal 2035. Integration of JSR's research, manufacturing and customer operations. Potential divestment of non-core businesses. New product development in advanced semiconductor materials. Global demand for AI chips, advanced lithography and semiconductor packaging. These indicators will provide a clearer picture of whether the acquisition can deliver the long-term benefits anticipated by Mitsui Chemicals. Conclusion: A Strategic Bet on the Future of Semiconductor Materials Mitsui Chemicals' proposed ¥1.84 trillion acquisition of JSR represents more than a major corporate transaction. It is a strategic bet on the growing importance of advanced materials in the global semiconductor industry. By combining Mitsui Chemicals' established specialty materials capabilities with JSR's expertise in advanced photoresists and semiconductor technologies, the company aims to establish a stronger position in a market that is becoming increasingly critical to AI, high-performance computing and next-generation electronics. For Japan, the transaction could reinforce its position in one of the most strategically important segments of the global technology supply chain. For Mitsui Chemicals, however, the opportunity comes with a substantial financial commitment, significant integration requirements and the responsibility of delivering the promised business synergies. The real measure of success will not be the size of the acquisition announcement, but whether the combined organisation can translate its technological strengths into sustained innovation, stronger customer relationships and long-term profitability. The semiconductor race is no longer defined only by who manufactures the most advanced chips. It is also about who controls the materials, technologies and capabilities that make those chips possible. Mitsui Chemicals' proposed acquisition of JSR is a clear reflection of that changing industrial landscape. Team BONC Network November 14th, 2026
#MitsuiChemicals#JSRCorporation#SemiconductorIndustry
Whitepaper
Why GDP Growth Lies to Us
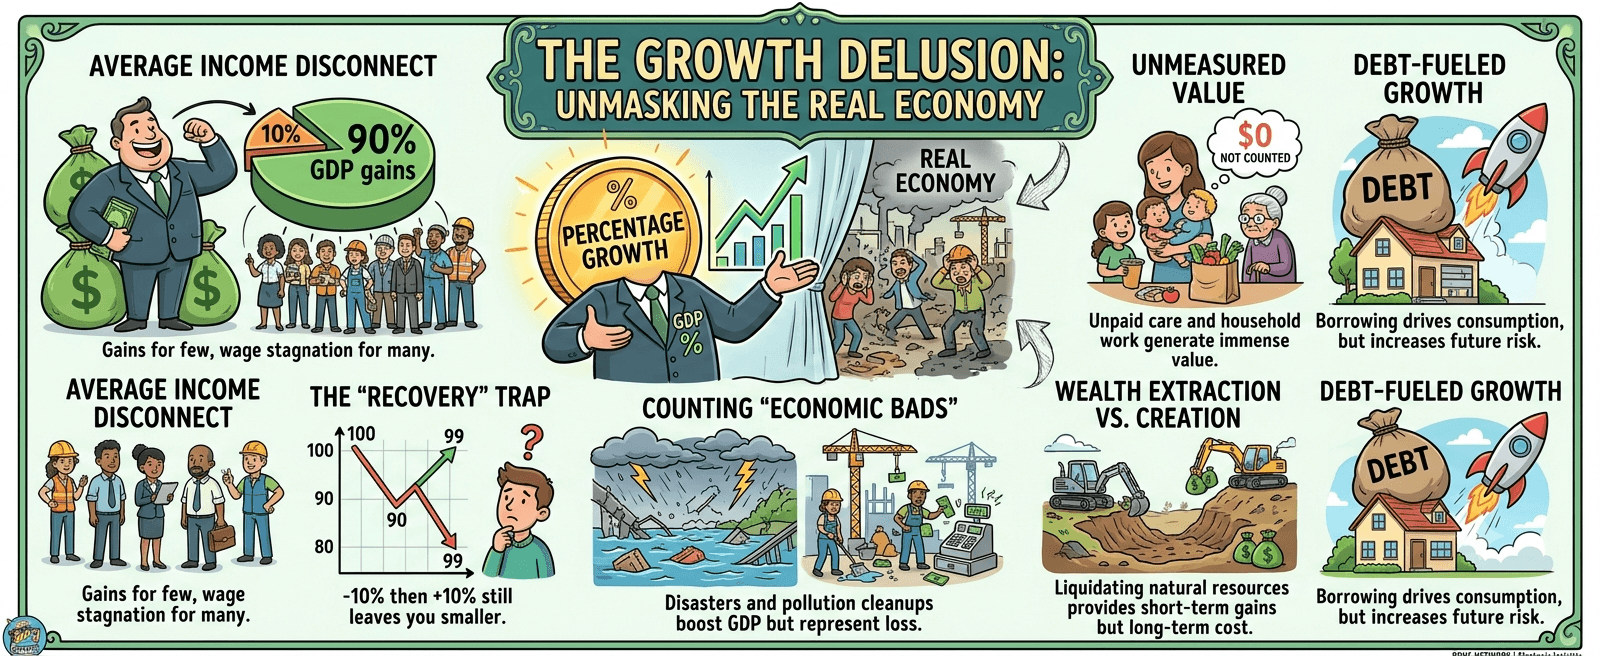
Gross Domestic Product (GDP) GDP growth is the standard metric governments and central banks use to gauge economic health. Yet relying on a single headline growth percentage to measure societal prosperity is fundamentally flawed. Simon Kuznets, the economist who created the basic framework for GDP in the 1930s, famously warned Congress: "The welfare of a nation can scarcely be inferred from a measure of national income." 1. Distributional Blindness: Aggregate Totals vs. Individual Realities GDP measures total monetary output produced within borders, but it remains completely blind to distribution. An economy can report 6% annual GDP growth while real wages for 90% of workers stagnate. If corporate earnings and upper-tier asset values surge, overall output expands rapidly on paper. However, the average household experiences zero improvement in purchasing power, creating a sharp divide between official statistics and lived economic reality. 2. Statistical Base Effects: The Illusion of High Percentages Percentage growth figures heavily depend on the baseline starting point, which frequently creates statistical illusions. The Recovery Trap: If an economy contracts by -10% during a recession (dropping from 100 to 90) and then expands by +10% the following year, it has not recovered its original size. A 10% increase on 90 equals 99, leaving national output below pre-crisis levels despite a headline-grabbing double-digit expansion rate. Base Size Disparities: A developing nation growing at 7% off a $200 billion baseline adds $14 billion in new output. Conversely, a mature economy growing at just 2% off a $20 trillion baseline adds $400 billion. The higher percentage does not mean greater absolute wealth creation. 3. Conflating Destruction with Value Creation GDP counts any financial transaction that occurs within an economy as positive, regardless of whether that spending represents genuine advancement or emergency repair. Natural Disasters: Hurricanes, floods, and wildfires trigger massive spikes in construction contracts, medical bills, and insurance payouts. These expenditures boost GDP growth, despite the net loss of infrastructure, homes, and human life. Environmental Degradation: Industrial pollution increases GDP twice: first when goods are manufactured, and again when governments spend money on environmental remediation and healthcare treatment for affected citizens. Defensive Spending: Rising crime rates generate economic activity through security installations, legal fees, and prison construction. Every dollar spent defending life or property increments GDP identically to dollars spent on education or technology. 4. Ignoring Unpaid Work and Informal Markets Because GDP tracks monetized market transactions, it ignores crucial non-monetized economic activity: Caregiving and Domestic Work: Unpaid childcare, eldercare, cooking, and community volunteering contribute tremendous value to societal wellbeing, yet count for zero in GDP statistics. The Informal Economy: In many developing nations, millions of micro-entrepreneurs operate outside formal banking and tax networks. Official GDP growth rates regularly overlook this underlying activity. 5. Liquidation of National Wealth for Short-Term Output GDP records short-term income flows rather than long-term asset reserves. A nation can engineer rapid, temporary GDP growth by over-logging forests, exhausting freshwater aquifers, or over-mining mineral reserves. On economic balance sheets, this liquidation appears as high productivity growth, but in reality, it represents the rapid depletion of national capital reserves. Holistic Alternatives Measuring True Progress To address these blind spots, economists have developed alternative indices that evaluate human welfare, sustainability, and equity alongside financial output. Genuine Progress Indicator (GPI): Takes standard GDP expenditure figures, subtracts costs associated with crime, pollution, and resource depletion, and adds value for unpaid household work and volunteering. Human Development Index (HDI): Evaluates national progress by blending gross national income per capita with life expectancy and educational attainment levels. Social Progress Index (SPI): Measures non-economic dimensions of well-being directly, focusing on basic human survival needs, access to knowledge, health systems, and personal freedom. November 13th, 2026
#GDP#EconomicGrowth#Macroeconomics
Data Analysis
Negative GDP vs. Real Growth: Decoding 2026 Global Economic Divergence
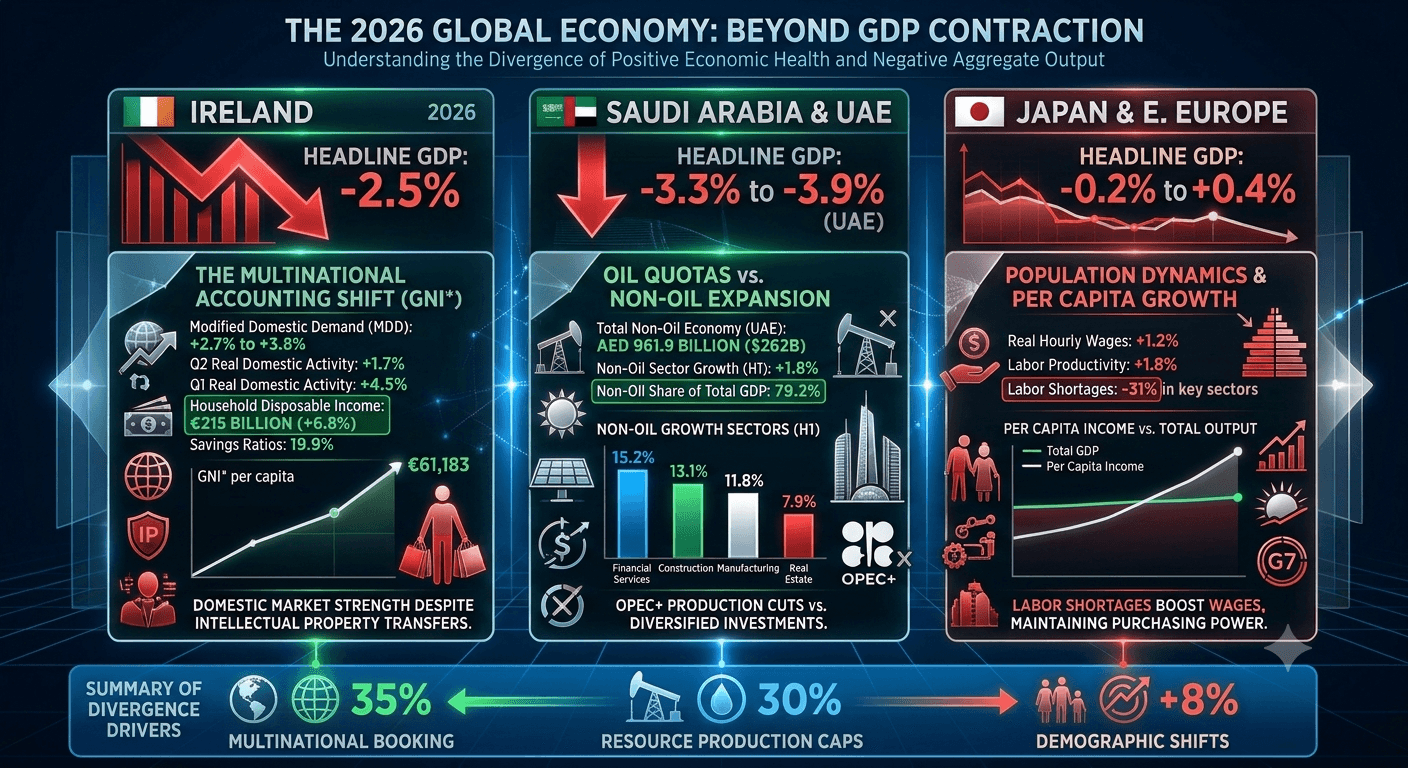
A falling Gross Domestic Product is traditionally viewed as a sign of economic distress. However, dynamic structural shifts across key international markets are proving that a contracting headline GDP no longer tells the full story. From corporate tax reallocations in Western Europe to oil production caps in the Middle East, high-performing nations are expanding real household incomes, domestic investment, and consumer purchasing power—even as aggregate top-line output figures drop into negative territory. The divergence between negative (or contracting) Gross Domestic Product (GDP) and positive underlying economic health occurs when external factors, accounting distortions, or trade quotas suppress geographic output numbers while domestic consumption, net household income, and employment remain robust. Understanding the Core Divergence Mechanics Gross Domestic Product (GDP): Measures the market value of final goods and services produced strictly within a nation's geographical borders. Gross National Income (GNI) & Modified Domestic Demand (MDD): Measure the actual income earned by a nation’s residents and domestic businesses, stripping out foreign corporate profit flows, distortionary intellectual property (IP) transfers, or external supply constraints. Ireland: The Multinational Accounting Shift Ireland exhibits severe economic divergence due to global tax strategies and intellectual property shifts by multinational technology and pharmaceutical conglomerates. Core Financial Data & Growth Figures Headline GDP Contraction: GDP contracted by 12.1% in Q1 2026 before registering a sharp rebound in Q2. Overall 2026 GDP is projected to fall by 2.5% following an abnormal export surge in 2025. Modified Domestic Demand (MDD): Real domestic economic activity expanded by 1.7% year-on-year in Q2 2026 (following a 4.5% rise in Q1), with full-year MDD projected to grow by 2.7% to 3.8% . Consumer Spending & Income: Domestic consumer spending grew by 2.9% year-on-year in Q2 2026 . Real gross disposable income per household stands 6.8% higher than pre-pandemic baselines, while nominal household income expanded to €215 billion . Per Capita GNI Expansion: * Modified Gross National Income per capita rose to €61,183 . Household savings ratios remained at Eurozone highs near 19.9% . Primary Structural Driver Multinational firms shifting IP assets and foreign production out of Irish subsidiaries artificially depress local trade balances. Despite headline GDP declines, domestic capital investments in AI hardware (up 24% year-on-year) and low domestic unemployment (around 5.0%) keep the real domestic economy strong. Saudi Arabia & The United Arab Emirates: Oil Quotas vs. Non-Oil Expansion Gulf Cooperation Council (GCC) economies illustrate a structural split caused by physical export caps in the energy sector paired with massive domestic infrastructure investments. Core Financial Data & Growth Figures Total GDP Movement: Overall real GDP growth slowed to 0.4% in H1 2026 for the UAE (with a 2.1% quarterly output contraction in Q2) due to OPEC+ crude production cuts and regional trade route adjustments. Non-Oil Economy Expansion: The non-oil sector grew by 1.8% in H1 2026 , reaching a total value of AED 961.9 billion ($262 billion) . Diversification Footprint: Non-oil activity reached 79.2% of total UAE GDP in 2026, up from 78.1% in the prior period. Key Growth Sectors: Non-oil expansion was driven by Financial and Insurance Activities (15.2% share of non-oil GDP), Construction (13.1%), Manufacturing (11.8%), and Real Estate (7.9%). Local business registrations for AI and technology expanded by 31% . Primary Structural Driver Physical cutbacks in crude oil output drag down headline GDP figures. Simultaneously, non-hydrocarbon investments, real estate development, and regional financial services expand, generating strong private sector revenue despite total output slowdowns. Japan & Central/Eastern European Nations: Demographics & Output Volatility Demographic shifts create scenarios where aggregate geographical output flattens or shrinks, but individual economic prosperity improves. Core Financial Data & Growth Figures Aggregate Real GDP: G7 quarterly GDP growth moderated to 0.3% , with nations like Germany and Italy slowing to 0.2% and periodically touching negative quarterly bounds. Per Capita Output & Living Standards: Despite aggregate GDP stagnation (hovering between -0.2% and +0.4%), average real hourly wage growth and labor productivity per active worker expanded by 1.2% to 1.8% across declining labor pools. Primary Structural Driver A contracting workforce limits total volume production, causing top-line GDP to drop or stay flat. However, severe labor shortages drive up real wages, maintaining per-capita purchasing power, high employment security, and strong domestic spending. "Think wider, think beyond — BONC it!" Team BONC Network
#IrelandEconomy#IrishBusiness#GCC

Industry Report
India’s Strategic $22 Billion Defense Modernization Surge
In an assertive push to safeguard national sovereignty, enhance multi-domain deterrence capabilities, and systematically reshape the regional balance of power, New Delhi has granted in-principle administrative approval for a massive ₹2.12 trillion ($22.27 billion) military spending blueprint . This major financial outlay comes at a critical juncture as continuous strategic requirements along the 3,488-kilometer Line of Actual Control (LAC) with China necessitate high-altitude defense readiness, advanced technological integration, and high-velocity battle-space awareness. Rather than relying purely on legacy force deployments, India’s latest defense modernization initiative signals a profound structural shift: integrating autonomous domain dominance, deep surveillance networks, localized defense-industrial manufacturing, and rapid-response tactical infrastructure across key border sectors. Chaired by the Union Ministry of Defence under the Defence Acquisition Council (DAC), this move accords Acceptance of Necessity (AoN) to a spectrum of cutting-edge land, air, and maritime defense platforms. Key Strategic Pillars Driving the $22 Billion Capital Deployment Multi-Domain Capability Overhaul: Directs capital across high-altitude artillery systems, autonomous counter-drone shields, long-range loitering munitions, and specialized naval electronic countermeasures. Indigenous Sourcing Imperative: Targets an ambitious 82% domestic procurement reserve , channeling the vast majority of production mandates toward public sector defense units and domestic technology conglomerates. Accelerated Sanction Velocity: Pushes cumulative military procurement clearances past ₹3.70 trillion ($40+ billion) within a single fiscal year timeframe, reflecting unprecedented administrative agility in clearing defense hardware acquisitions. Asymmetric Technological Balance: Focuses heavily on network-centric warfare tools, real-time aerial sensor integration, counter-UAS platforms, and intelligent target acquisition to neutralize force-asymmetry challenges across rugged Himalayan geography. Detailed Data Breakdown and Fiscal Metrics The newly sanctioned budget framework builds upon India’s expanding national defense capital expenditure allocation. To understand the scale, velocity, and focus of this massive rollout, examine the foundational figures driving this authorization: Total DAC Clearance Approval: ₹2,12,000 Crore ($22.27 Billion USD) dedicated primarily to capital acquisition, advanced tech integration, and border hardware modernization. Cumulative Fiscal Approvals: ₹3,70,000 Crore cleared across recent administrative procurement cycles, marking one of the fastest capital sanction drives in modern Indian defense history. Global Procurement Standing: India accounts for approximately 8.2% of global major arms imports , making it the world’s second-largest defense importer—a posture New Delhi intends to systematically transform via localized procurement mandates. Domestic Defense Sector Allocation: Over ₹1,73,800 Crore (~$18.2 Billion) of the new outlay is reserved explicitly for Indian original equipment manufacturers (OEMs), defense technology innovators, and private engineering firms. Core Impact Areas: Modernization in Focus 1. High-Altitude Surveillance, Tactical UAVs, and Loitering Munitions A substantial portion of the approved capital explicitly targets aerial domain awareness and precision strike capability. Strategic acquisitions focus on long-range Unmanned Aerial Systems (UAS) capable of continuous, all-weather reconnaissance across high-altitude border regions including Eastern Ladakh, Sikkim, and Arunachal Pradesh. These platforms will operate alongside long-range kamikaze drone systems and Integrated Surveillance and Strike Systems, ensuring squad-level visibility coupled with instantaneous real-time strike capabilities. 2. Counter-Drone Shields and Air Defense Systems Recognizing the rapid proliferation of unmanned strike threats and drone swarms in modern theater warfare, New Delhi is deploying multi-layered air defense systems. Approvals cover Very Short-Range Air Defense Systems (VSHORADS) alongside Platform-Based Counter-Unmanned Aerial Systems (C-UAS). These systems combine electronic warfare jamming suites with kinetic interception capabilities to secure forward bases, logistical choke points, and tactical staging areas along sensitive border frontiers. 3. Precision Long-Range Firepower and Tactical Mobility High-altitude standoff experience along mountain corridors has underscored the vital importance of high-mobility heavy firepower. The procurement plan includes Self-Propelled Tracked Gun Systems, High Mobility Vehicles (HMVs) for troop and supply transit across rugged terrain, Gun Shot Response Systems (GSRS) for instantaneous counter-battery detection, and specialized Light Multi-Role Helicopters (LMRH) tailored for high-altitude vertical insertion. 4. Naval Dominance and Maritime Security While land and air boundaries require immediate reinforcement, India continues to secure its maritime flank across the Indian Ocean Region (IOR). The Navy receives capital allocations for Active Offboard Decoy Systems (AODS) and major naval defense platforms, protecting carrier strike groups and surface assets against anti-ship missile threats and submarine tracking. 5. Tactical Weather Intelligence and Border Infrastructure Support Modern high-altitude defense warfare relies on accurate environmental data. The Air Force segment of the capital package incorporates Mobile X-Band Doppler Weather Radars, enabling precision flight planning, artillery trajectory calculations, and missile guidance under dynamic Himalayan atmospheric conditions. Industrial Strategy: Local Manufacturing vs. Global Technology Fusion India’s defense modernization strategy relies on a balanced dual-track model. Under the Make in India and Atmanirbhar Bharat policies, domestic manufacturing receives priority allocation, fostering an ecosystem of domestic defense suppliers. Concurrently, the rapid evolution of modern defense hardware encourages global technology partnerships. International aerospace and defense contractors are engaging in technology transfers, joint design ventures, and co-production agreements covering specialized optics, radar sensors, micro-electronics, and jet propulsion systems. Geopolitical Outlook and Regional Deterrence New Delhi’s approval of $22 billion in military procurement reinforces a long-term strategic principle: border stability is fundamentally linked to unshakeable defensive strength. By directing capital into high-tech ISR, autonomous drone networks, air defense coverage, and high-altitude mobility, India reinforces its operational posture along its northern borders. As these capital clearances transition into signed production contracts and active deployments over the coming quarters, the Indian Armed Forces are set to gain greater technological autonomy, higher battlefield agility, and resilient multi-theater readiness. Team BONC Network October 26, 2026
#IndiaDefense#DefenseModernization#IndianArmedForces

Industry Report
Nvidia’s $12.9B Hugging Face Deal - DOJ Expands Antitrust Inquiry
Executive Summary Transaction Value: $12.93 billion total transaction value, comprising approximately $11.9 billion in equity/cash value and a $1 billion operational retention fund. Core Investigation Target: The U.S. Department of Justice (DOJ) is investigating whether acquiring the dominant open-source repository gives a single hardware manufacturer total control over the primary distribution pipeline for artificial intelligence software. Broader Regulatory Probe: The Hugging Face acquisition has been formally tied into a multi-year antitrust investigation into semiconductor supply chain dominance, which also targets previous transactions including SchedMD ($2025$), Run:ai, and talent/licensing arrangements with Groq ($20 billion aggregate framework). Target Completion: The acquisition is projected to close in the first half of 2027 , pending antitrust approvals. Federal antitrust regulators at the U.S. Department of Justice have formally expanded an active, multi-pronged anti-monopoly probe into the high-performance computing hardware sector, focusing heavily on Nvidia’s definitive $12.93 billion agreement to acquire Hugging Face. The regulatory scrutiny focuses on platform neutrality, open access, and software distribution across global AI infrastructure. Key Scrutiny Vectors Under Inquiry Control of AI Distribution Hubs: Antitrust regulators are examining whether acquiring the world's largest open-source hub—hosting millions of datasets, open-weight models, and developer tools—creates a single chokehold over developer software distribution networks. Cross-Architecture Hardware Neutrality: Regulatory officials are questioning whether post-acquisition software optimizations could give proprietary accelerator processing units unfair technical advantages over competing processing chips or alternative cloud platforms. Pattern of Infrastructure Consolidation: The DOJ inquiry incorporates the Hugging Face deal into a broader review of hardware and software acquisitions, including supercomputing workload management tool SchedMD, efficiency software creator Run:ai, and high-value technology licensing/hiring deals with Groq. Industry Impact & Platform Guarantees In response to federal inquiries, executive leadership has maintained that Hugging Face will remain an open, platform-neutral hub supporting third-party hardware architectures, competing cloud networks, and open frameworks. While no formal enforcement action or injunction has been filed, regulators continue to solicit feedback from competing hardware developers and cloud providers to determine if platform ownership threatens market competition across the digital supply chain. Industry Impact Analysis: Developers & Cloud Infrastructure The Department of Justice’s probe into Nvidia’s $12.93 billion acquisition of Hugging Face highlights structural shifts across the broader software and hardware supply chains. Below is an examination of how this inquiry and potential acquisition directly affect open-source developers and third-party cloud infrastructure providers. Impact on Open-Source AI Developers Neutrality and Platform Independence: Hugging Face acts as the central hub for open-weight models, hosting over millions of shared datasets, model weights, and application spaces. Developers rely on its vendor-agnostic foundation. The primary concern among open-source builders is whether default optimization layers will subtly favor CUDA-native acceleration over open frameworks. Developer Workflow Integration: Nvidia’s integration could streamline deployment pipelines by embedding specialized libraries directly into standard Hugging Face workflows. While this improves performance out-of-the-box for standard compute setups, developers using non-standard or custom accelerator architectures fear increased integration friction. Preservation of Open Access: Regulators are examining whether free-tier hosting, open model repositories, and public spaces will remain fully subsidized or shift toward monetized, hardware-bound enterprise features over time. Impact on Third-Party Cloud Providers Hyperscaler Competition: Major cloud platforms—such as Amazon Web Services, Google Cloud, and Microsoft Azure—rely heavily on Hugging Face hosted container instances. Ownership by a single hardware manufacturer raises strategic questions about compute-tier neutrality and direct cloud partnership dynamics. Alternative Hardware Providers: Emergent processing unit manufacturers and custom silicon designers face potential distribution bottlenecks if model optimization presets default to established proprietary chip architecture. Deployment Portability: Enterprise cloud architects are increasingly evaluating containerized, multi-repository strategies to prevent vendor lock-in and ensure models can be seamlessly migrated across diverse infrastructure environments. Long-Term Market Implications Federal regulatory oversight serves as a stabilizing force to ensure that commitments to vendor-neutral distribution, open model hosting, and cross-architecture interoperability are enforced throughout the multi-year approval process.
#AI#Antitrust#Semiconductors

Data Analysis
Anthropic’s Landmark S-1 Public Filing: Scale, Financial Liabilities, and Mission Governance
San Francisco / Global Tech Analysis | October 27, 2026 The registration statement filed by Anthropic —the artificial intelligence research organization and developer behind the Claude model family—has provided the global financial and technology sectors with an unprecedented look into the hyper-scale economics driving frontier AI. Anthropic's S-1 prospectus reveals an operational landscape defined by rapid revenue acceleration, immense noncancelable computing obligations, non-cash equity accounting adjustments, and a specialized corporate governance framework designed to balance commercial expansion with AI safety mandates. As the organization prepares for an initial public offering targeting a valuation between $1.5 trillion and $2 trillion , this analysis breaks down the core structural insights from the filing. 1. Top-Line Acceleration vs. Noncancelable Infrastructure Liabilities The central structural tension highlighted in Anthropic's prospectus is the direct link between enterprise software adoption and long-term capital commitments required to sustain foundation models. Key Qualitative Insights: Explosive Top-Line Trajectory: Demonstrating strong commercial product-market fit, Anthropic reported $16.3 billion in revenue for the first half of the year , representing a fourteen-fold (1,300%+) increase compared to $1.16 billion in the same period the previous year. This growth is primarily driven by enterprise integration of the Claude API suite, agentic developer workflows, and expanding enterprise spending across key corporate cohorts. Long-Term Infrastructure Locking: To support its training and inference requirements, Anthropic disclosed more than $475 billion in compute capacity agreements with multi-year cloud partners. The filing notes that these contracts are overwhelmingly noncancelable , obligating the organization to fixed hardware and energy outlays over extended horizons regardless of future market fluctuations. Capital-Intensive Model Economics: Securing hundreds of billions in infrastructure commitments highlights that competitiveness in frontier AI is directly bound to capital depth, data center access, and power supply allocation. Servicing these fixed obligations requires Anthropic to sustain continuous revenue growth at scale. 2. The Profitability Paradox: Operational Focus vs. Non-Cash Accounting Adjustments Anthropic’s financial disclosures present a distinction between core operational results and total reported net income. Key Qualitative Insights: Accounting Loss Mechanics: The prospectus reported a net loss of $80.7 billion for the first half of the year. The filing clarifies that roughly $72.4 billion of this total stems from non-cash accounting adjustments related to the fair-value remeasurement of convertible instruments and equity obligations as the enterprise valuation rose. These charges represent equity accounting entries rather than direct operational cash burn. Underlying Operational Execution: Anthropic recorded an operating loss of $693 million against $16.3 billion in revenue during the first half. This operational performance indicates that direct serving, unit-level inference costs, and baseline administrative expenses are stabilizing as revenue volume expands. Balance Sheet Liquidity Buffer: To manage capital outlays and maintain operational runway, Anthropic holds $112.4 billion in cash and cash equivalents . This liquidity reserve provides a buffer to cover ongoing compute commitments and support research and development initiatives. 3. Public Offering Architecture, Governance, and Risk Profile The capital structure of the proposed offering and the explicit risk disclosures position Anthropic in a unique category among public market technology listings. Key Qualitative Insights: Landmark Offering Scope: Aiming to raise approximately $100 billion at a targeted public valuation of $1.5 trillion to $2.0 trillion , the offering is designed to fund next-generation compute clusters, custom hardware access, and global enterprise operations. Mission-Oriented Governance: Operating as a Public Benefit Corporation (PBC), Anthropic incorporates unusual governance arrangements that prioritize safe and aligned AI development over short-term financial optimization. These mechanisms leave ordinary public equity holders with limited voting control over strategic and safety policies, requiring public investors to align with management’s long-term governance mission. Explicit Disclosure of Systemic Threats: The prospectus details risks associated with frontier AI deployment, including potential vulnerabilities related to automated cyber exploits, biological information synthesis, and alignment challenges in autonomous agentic systems. The filing also highlights external dependencies such as semiconductor export controls, regional regulatory divergence, and power grid infrastructure availability. Conclusion: A Benchmark for Frontier AI Capital Markets Anthropic’s S-1 filing demonstrates the scale and structural complexity of modern AI development. The prospectus presents an enterprise achieving rapid revenue growth alongside long-term infrastructure commitments and non-cash equity accounting adjustments. As Anthropic moves toward its public debut with specialized governance structures intact, its financial execution will serve as a primary indicator for how public equity markets price hyper-growth, long-term capital liabilities, and technological governance.
#Anthropic#ClaudeAI#TickerAN

Industry Report
Democratic and Trustworthy Technology Forum | Taipei | October 27, 2026
Fortifying Democratic Tech Supply Chains: Key Outcomes from the 2026 Democratic and Trustworthy Technology Forum As advanced technologies reshape global geopolitics, democratic nations are prioritizing secure, transparent, and resilient supply lines. On October 27, 2026, Taiwan’s Ministry of Foreign Affairs (MOFA) co-hosted the Democratic and Trustworthy Technology Forum alongside the Formosa Club in Taipei. The high-level event brought together nearly 50 parliamentarians and security experts representing 19 European nations alongside Taiwanese decision-makers. Discussions focused on joint initiatives across artificial intelligence (AI), uncrewed aerial systems (drones), and the construction of trusted, non-authoritarian hardware ecosystems. Event at a Glance Event Title: Democratic and Trustworthy Technology Forum Date: October 27, 2026 Location: Taipei, Taiwan Co-Hosts: Ministry of Foreign Affairs of Taiwan & The Formosa Club Delegation Composition: European Parliament representatives, national lawmakers from 19 European countries, and leading Taiwanese technology and security strategists. Key Focus Areas & Core Outcomes 1. Trustworthy Artificial Intelligence Governance Participants emphasized that the advancement of AI demands strict compliance with democratic values, transparent algorithms, and robust data protection standards. Ethics and Standard-Setting: Establishing shared operational guidelines to ensure AI deployment remains transparent, traceable, and protected against algorithmic manipulation or unauthorized access. Industrial & Robotic Cyber Defense: Collaborating on hardware security architecture to shield automated manufacturing, industrial robotics, and critical public infrastructure from foreign cyber exploits. 2. Autonomous Drone Systems and Critical Infrastructure Protection Unmanned aerial and underwater assets emerged as critical strategic priorities for both commercial resilience and security. Joint Technical Innovation: Attendees advocated for accelerated research and co-production of commercial and security drone systems, ensuring software and components originate from trusted partners. Subsea Communications Vulnerabilities: Panels highlighted the security of undersea fiber-optic communication cables as vital to international digital stability. Delegates recommended joint deployment of unmanned underwater vehicles (UUVs) to monitor and protect subsea transmission cables. 3. Resilient "Non-Red" Supply Chains Given Taiwan’s central role in global semiconductor fabrication and advanced technology production, delegates focused on protecting critical supply networks. Decoupling from High-Risk Suppliers: Creating "non-red" technology corridors that eliminate dependency on vendors operating under non-democratic regulatory frameworks. Strengthening Europe–Taiwan Synergies: Aligning Taiwan's specialized microelectronics and hardware design sector with Europe’s strategic autonomy objectives to insulate international trade against geopolitical disruptions. Strategic Alignment Delegates affirmed that technological security directly reinforces national sovereignty. European participants highlighted Taiwan's indispensable role as a high-tech manufacturing partner, emphasizing that establishing shared, secure standards for critical technologies ensures economic stability and defends shared democratic values worldwide. Over 50 European Parliament Members Visit Taiwan This news video reports directly on the October 27 forum in Taipei, covering the delegation of European lawmakers discussing joint AI and drone supply chain initiatives with Taiwanese representatives. As critical technologies redefine global geopolitics, Taiwan’s MOFA and the Formosa Club convened European lawmakers and security leaders in Taipei to forge resilient, non-authoritarian supply chains for AI and unmanned systems.
#TrustworthyTech2026#DemocraticTechForum#BONCNetwork
Trend & Future Insight
Inside the $1 Trillion+ Defense Shift: AI Drones, Nuclear Modernization, and Record Budgets
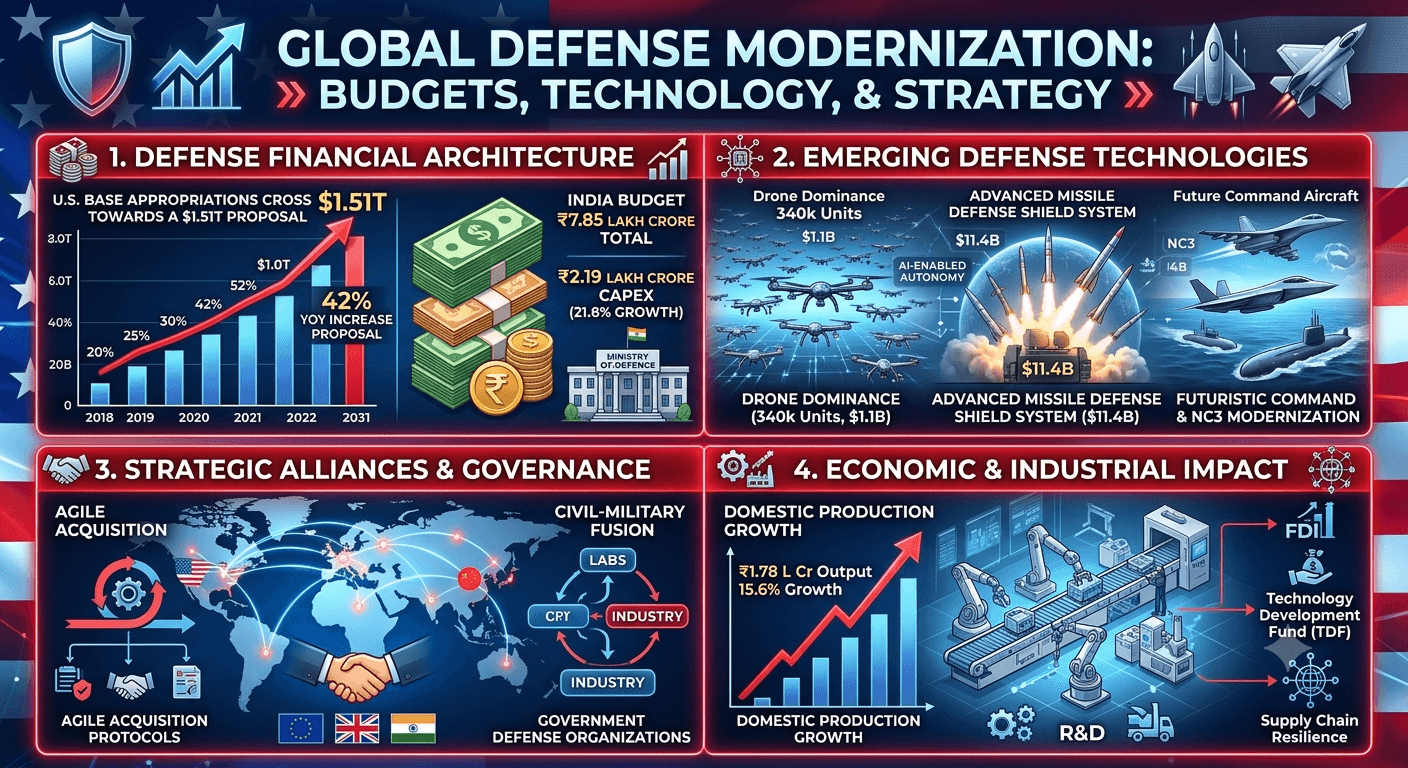
The Global Defense Modernization Paradigm: Budgetary Expansion, Technological Breakthroughs, and Strategic Realignment The global defense landscape is experiencing a structural transition characterized by rapid technological integration, record-breaking defense allocations, and a strategic pivot from traditional deterrence toward multi-domain, highly autonomous, and network-centric warfare. Leading powers and international defense bodies are executing unprecedented modernizations to address complex geopolitical dynamics, supply chain vulnerabilities, and the emergence of asymmetric threat vectors. At the center of this transformation is a massive reallocation of financial capital toward capital expenditure, research and development (R&D), and civil-military technological fusion. This comprehensive analysis covers global budgetary dynamics, emerging technology implementations, institutional governance changes, and key financial and strategic metrics shaping global defense policy. 1. Global Defense Financial Architecture & Budget Allocations Recent national budget releases highlight an aggressive upward trajectory in overall defense spending, with significant growth shifted toward long-term modernization projects, capital outlays, and advanced platform acquisitions. Key Financial Insights & Capital Breakdown United States Budgetary Acceleration: The U.S. defense spending framework passed a historic milestone by crossing $1.0 trillion in FY 2026, with an ambitious FY 2027 proposal of $1.51 trillion representing a 42% year-over-year increase . The FY 2027 discretionary request accounts for $1.15 trillion (a 28% baseline increase ), supplemented by $350 billion in mandatory reconciliation funding. Capital allocation focuses heavily on strategic modernization, including over $756.8 billion allocated to industrial capabilities, $75+ billion to space-based assets, and $20+ billion to cyber defense infrastructure. India's Modernization Shift: The Ministry of Defence received an all-time high allocation of ₹7.85 lakh crore ($85.7 billion) for FY 2026–27, marking a 15.2% YoY overall increase . Capital expenditure (CapEx) experienced a significant 21.8% growth , reaching ₹2.19 lakh crore ($23.9 billion) , excluding civil outlays. CapEx now accounts for 37.7% of the total defense budget (excluding pensions), signaling a deliberate departure from revenue-heavy operational maintenance toward next-generation hardware and platform inductions. Revenue expenditure for operational readiness and troop maintenance stands at ₹3.65 lakh crore ($39.9 billion) —a 16.6% increase —with ₹88,053 crore ($9.62 billion) earmarked specifically for repairs, stores, and civil works. 2. Emerging Technologies and Operational Capabilities Military forces are transitioning from hardware-centric platforms to software-defined, autonomous, and artificial intelligence-enabled environments. Modern battlefields prioritize speed, scalability, distributed lethality, and operational survivability. Primary Focus Areas Autonomous Unmanned Aerial Systems (UAS) & Drone Dominance: Mass Procurement Scale: Tactical doctrine is heavily focusing on uncrewed systems. Initiatives like the $1.1 billion Drone Dominance Programme aim to field approximately 340,000 small, weaponized, and autonomous UAS to forward combat units. Funding Allocation Growth: Global counter-UAS and autonomous technology budgets have tripled, with tactical drone/counter-drone investments reaching $74 billion in U.S. requests. Advanced Missile Systems & Integrated Air Defense: Terminal and Exo-Atmospheric Shielding: Allocation for missile defense includes $11.4 billion earmarked for Terminal High Altitude Area Defense (THAAD) interceptors (procuring 857 units , with a baseline of 450+ interceptors annually through 2031). Ground-Based Midcourse Defense (GMD): Midcourse defense R&D funding expanded by 83.2% , growing from $764 million to $1.4 billion . Glide-Phase Interceptors & Advanced Sensors: Glide-phase interceptor programs rose to $214 million ( +15.6% ), while specialized tracking sensor development saw a 372.6% increase from $183 million to $865 million . Nuclear Modernization & Strategic Command, Control, and Communications (NC3): Sea-Based Deterrence: Funding for the Trident II Life Extension Program escalated to $3.9 billion , while W93 warhead Mark 7 aeroshell R&D expanded from $619 million to $841 million ( +35.8% ). Airborne Command Platforms: NC3 survivability investments increased the Survivable Airborne Operations Center (E-4 replacement) budget from $1.8 billion to $2.2 billion ( +22.2% ) and the E-130J platform (E-6B Mercury replacement) from $1.2 billion to $1.9 billion ( +58.3% ). Naval Fleet Expansion & Maritime Subsurface Deterrence: Maritime force structure emphasizes stealth frigates and nuclear-powered ballistic missile submarines (SSBNs). Recent operational developments include the commissioning of the 3rd Arihant-class SSBN ( INS Aridaman ) and completion of the P-75 submarine series ( INS Vaghsheer ), supporting a strategic goal of an operational 170+ vessel fleet . 3. Institutional Governance, Policy Frameworks, and Strategic Alliances Government defense organizations, ministries, and procurement agencies are overhauling procedural regulations to accelerate technological adoption and strengthen domestic industrial ecosystems. Strategic Governance Initiatives Transition to Agile Acquisition Protocols: Military organizations are replacing rigid acquisition frameworks with Agile Acquisition Protocols . This procedural evolution allows rapid spiral development, iterative prototyping, and continuous software deployment rather than requiring fully locked hardware specifications prior to initial production. Institutionalizing Civil-Military Fusion: National defense authorities are establishing formal Civil-Military Fusion Frameworks to bridge commercial technology sectors and defense laboratories. This approach accelerates the deployment of dual-use technological advances, including quantum computing, generative AI, edge computing, and commercial satellite communications. Partnering initiatives, such as the Development cum Production Partner (DcPP) Model , have engaged over 134 corporate entities alongside major R&D organizations, producing 2,180+ technology transfer agreements and opening 2,780+ intellectual property rights (IPRs) to private defense manufacturers. Bi-Lateral Security Coalitions & Bilateral Pacts: Strategic realignments include landmark international security pacts, such as the EU-India Security and Defence Partnership , which expanded cross-border cooperation in cyber resilience, maritime domain awareness, space domain tracking, and joint supply chain security. 4. Economic Dynamics: Indigenization, R&D, and Foreign Direct Investment Defense industrial policies are prioritizing domestic production capacity, supply chain self-reliance, and reduced dependency on foreign Original Equipment Manufacturers (OEMs). Industrial Base Growth Highlights Domestic Manufacturing Output: Annual domestic defense output reached ₹1,78,000 crore ($19.4 billion) , representing a 15.6% YoY growth over the previous year's ₹1,54,071 crore , and an aggregate 110% expansion compared to FY 2020–21 ( ₹84,643 crore ). Deep-Tech R&D Funding: Governments are deploying targeted venture funding mechanisms, such as an additional ₹500 crore corpus directed to the Technology Development Fund (TDF) , supporting active deep-tech developments in microelectronics, stealth materials, and autonomous algorithms. Foreign Direct Investment (FDI) & Co-Development: Cumulative FDI inflows into defense manufacturing reached ₹6,670.59 crore , supported by regulatory adjustments such as Basic Customs Duty (BCD) exemptions on raw materials and components imported for domestic Aircraft Parts Manufacturing and Maintenance, Repair, and Overhaul (MRO) facilities. 5. Strategic Outlook and Future Challenges While increased funding and accelerated technological deployment enhance operational capabilities, defense sectors globally encounter critical operational and structural challenges: Pensions and Revenue Absorption Balance: High personnel costs and pension liabilities (accounting for ₹1.71 lakh crore in specific major budgets) continue to compete with capital modernization accounts. Industrial Absorptive Capacity: Domestic manufacturing bases must balance rapid technological integration with quality assurance and supply chain scaling to prevent delivery bottlenecks. Multi-Domain Command Integration: Achieving unified operational execution across joint forces requires standardizing legal, logistical, administrative, and software systems across ground, air, naval, cyber, and space domain commands. BONC Network
#DefenseIndustry#DefenseTechnology#DefenseModernization