• Home

Business

  • Dashboard
  • My Products
  • Edit Business
  • My Groups

Explore

  • Articles
  • Community
  • Careers
  • Blogs
BONC logo
Get it on Google Play

Products

  • Pricing
  • Explore Industry
  • Explore Category
  • Explore Product
  • About Us

About BONC

  • FAQs
  • Terms and Condition
  • Privacy Policy
  • Refund Policy
  • Blogs

OFFICE LOCATION

Costipro Technologies Pvt. Ltd, Unit no. 235 to 245, Supremework Workspace, 2nd Floor, ILD Trade Center, Sector 47, Sohna Road, Gurgaon, Haryana - 122018

© 2025 - 2026 BONC Network. All rights reserved

BONC Logo
  • Home

Business

  • Dashboard
  • My Products
  • Edit Business
  • My Groups

Explore

  • Articles
  • Community
  • Careers
  • Blogs

Beyond Nike & Adidas: Top 25 Asian Homegrown Brands & Revenue Breakdown (2026)

Trend & Future InsightBy Consulting Expert · 10 Nov 2026
Beyond Nike & Adidas: Top 25 Asian Homegrown Brands & Revenue Breakdown (2026)

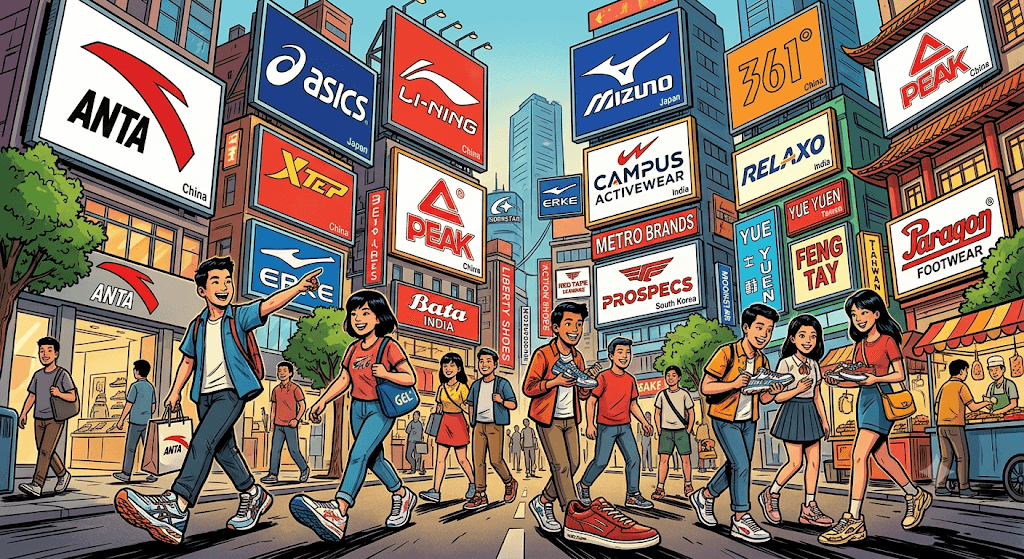
Over the past decade, a seismic shift has occurred across the global footwear landscape. Long dominated by Western legacy giants, the market is rapidly re-aligning around homegrown Asian powerhouses that have transformed from backend manufacturers into front-line global innovators.

1. The Giants of Greater China: Anta & Li-Ning Leading the Charge

Chinese athletic brands have evolved far beyond domestic popularity. Anta Sports—now generating over $11.4 billion in annual revenue—has cemented its place as the world’s third-largest sportswear group, rivaling legacy Western giants through savvy brand acquisitions (Amer Sports, FILA China) and high-profile global endorsements. Concurrently, Li-Ning and Xtep continue to capture market share with premier running technologies and high-end fashion crossovers.

2. Precision and Heritage: Japan’s Footwear Icons

Japan continues to set the benchmark for technical performance and subculture fashion. ASICS has seen surging global demand, driven by its heritage GEL tech and the explosive growth of Onitsuka Tiger in lifestyle segments. Meanwhile, Mizuno maintains its stronghold in specialized athletic disciplines, emphasizing sustainability and precision engineering.

3. The Indian Footwear Boom: Athleisure Meets Mass Retail

India represents one of the fastest-growing domestic markets in Asia-Pacific. Homegrown leaders such as Relaxo Footwears, Campus Activewear, Metro Brands, and Red Tape have capitalized on demographic tailwinds, urbanizing populations, and rising disposable incomes. Brands like Campus and Sparx (by Relaxo) have bridged the gap between affordable pricing and premium athleisure aesthetics, making performance footwear accessible to millions.

4. Manufacturing Hubs to Brand Owners

Contract manufacturing powerhouses like Taiwan’s Yue Yuen and Feng Tay remain essential backbones of global supply chains while expanding their retail footprints throughout Asia. Their deep technical expertise, coupled with direct-to-consumer (DTC) digital strategies, has given Asian brands an unparalleled advantage in speed-to-market and pricing efficiency.

Revenues reflect the latest trailing 12-month (TTM) figures / FY2025–FY2026 reported revenues converted to USD for direct comparison.

  1. Anta Sports (China) – ~$11.46 Billion - The largest homegrown Asian sportswear conglomerate, owning brands like Anta, FILA China, and stakes in Amer Sports & Puma.

  2. Yue Yuen Industrial (Taiwan/Hong Kong) – ~$7.85 Billion - Asia’s premier footwear manufacturing giant and owner of Pou Sheng retail.

  3. ASICS Corporation (Japan) – ~$4.10 Billion - Japan’s leading athletic footwear brand, famed for running performance (GEL series) and lifestyle line Onitsuka Tiger.

  4. Li-Ning (China) – ~$3.95 Billion - Founded by Olympic gymnast Li Ning; a dominant player in Chinese athletic and fashion footwear.

  5. Feng Tay Enterprises (Taiwan) – ~$2.70 Billion - Major footwear manufacturer operating extensive Asian design and production hubs.

  6. Xtep International (China) – ~$1.95 Billion - Massive player in running footwear and lifestyle sneakers across Greater China.

  7. Mizuno Corporation (Japan) – ~$1.55 Billion - A heritage Japanese brand known for performance running, baseball, and golf footwear.

  8. 361 Degrees (China) – ~$1.30 Billion - Major Chinese athletic brand expanding heavily across Asia-Pacific.

  9. Fila Holdings / Acushnet (South Korea) – ~$1.25 Billion - South Korea–headquartered global sportswear and footwear company.

  10. Bata India (India) – ~$420 Million - Though originating in Europe, Bata India operates as an independent homegrown titan across Indian retail.

  11. Relaxo Footwears (India) – ~$380 Million - India’s largest footwear manufacturer by volume (Sparx, Flite, Bahamas).

  12. Peak Sport (China) – ~$350 Million - Basketball and athletic footwear giant with global endorsements.

  13. Campus Activewear (India) – ~$185 Million - Fast-growing Indian sports and athleisure footwear brand.

  14. Metro Brands (India) – ~$280 Million - Leading Indian multi-brand retail footprint housing Metro, Mochi, and Walkway.

  15. Liberty Shoes (India) – ~$85 Million - Heritage Indian dress and casual footwear maker.

  16. Descente Asia / Japan (Japan) – ~$950 Million - High-performance Japanese athletic apparel and footwear brand.

  17. Red Tape (India) – ~$210 Million - Indian leather shoes and lifestyle footwear brand expanding globally.

  18. ABC-Mart Home Brands / Hawkins (Japan) – ~$2.10 Billion - Japan's footwear retail giant with proprietary home brands.

  19. Erke (China) – ~$320 Million - Popular Chinese sportswear and athletic shoe manufacturer.

  20. Moonstar (Japan) – ~$260 Million - Historic Japanese footwear brand specializing in vulcanized canvas shoes and footwear technology.

  21. K-Swiss / Palladium (Joyson Group / China) – ~$210 Million - Asian-owned heritage footwear labels under Chinese multi-brand portfolio.

  22. ProSpecs (South Korea) – ~$140 Million - Classic South Korean athletic and walking shoe manufacturer.

  23. Action Shoes (India) – ~$90 Million - Popular Indian dailywear and school shoe brand.

  24. Spira / Paragon Footwear (India) – ~$310 Million - Mass-market leader in value footwear and daily rubber/canvas shoes.

  25. Bata Malaysia / Asia Regional Holdings (Malaysia) – ~$110 Million - Independent regional hub serving Southeast Asian consumer markets.

Conclusion

As we head toward 2030, Asian footwear brands are no longer just domestic alternative options—they are global trendsetters. Through strategic M&A, cutting-edge running technology, and deep localization, Asia’s homegrown shoe brands are setting a new standard for the global footwear industry.

November 2026

#FootwearIndustry#RetailTrends#BusinessIntelligence#AsianMarket#MarketResearch#AntaSports#ASICS#LiNing#CampusActivewear#Relaxo

Comments (2)

SShweta Mishra

Shweta Mishra

2 days ago

The shift from "Made in Asia" to "Designed and Led by Asia" is officially reshaping the global sneaker and sportswear game.

PPooja Sharma

Pooja Sharma

2 days ago

Sad to see, Liberty shoes was one of the prominent name in Indian shoe market. Looks like lack of Branding and operating in Lala model has impacted the revenue to 80 Mln $. But good to see Relaxo and other brands have move ahead.

Latest Articles

View all

Company Articles

  • Best Door Hinges, Window Hinges, Stainless Steel, Brass & Mild Steel Hardware Fittings Supplier in India | INDIAN HARDWARE

    Best Door Hinges, Window Hinges, Stainless Steel, Brass & Mild Steel Hardware Fittings Supplier in India | INDIAN HARDWARE

    Ashik Mondol · few months ago

  • Premium Wash Basins, Sanitaryware & Bathroom Fittings for Residential and Commercial Projects | M/S SUPREME MARKETING

    Premium Wash Basins, Sanitaryware & Bathroom Fittings for Residential and Commercial Projects | M/S SUPREME MARKETING

    Rajesh Agarwal · few months ago

  • The Architecture of Adaptability: How the Post-Pandemic Era Rewrote the Corporate Playbook

    The Architecture of Adaptability: How the Post-Pandemic Era Rewrote the Corporate Playbook

    Vikas Garg · few months ago

  • Premium Roofing Materials, Floor & Wall Tiles, Roofing Fittings and False Ceiling Solutions in India | MURLI ENTERPRISES

    Premium Roofing Materials, Floor & Wall Tiles, Roofing Fittings and False Ceiling Solutions in India | MURLI ENTERPRISES

    Atanu Das · few months ago

  • Premium Marble, Granite, Ceramic & Porcelain Tiles Supplier in India | JAIN MARBLE CENTRE

    Premium Marble, Granite, Ceramic & Porcelain Tiles Supplier in India | JAIN MARBLE CENTRE

    Sonu Jha · few months ago

Networking Articles

  • Apple’s Nanosheet Era : The Hard Reality of 2nm Silicon

    Apple’s Nanosheet Era : The Hard Reality of 2nm Silicon

    Vikas Garg · few months ago

  • SHOPRITE AND INVESTEC JOIN FORCES TO TRANSFORM SOUTH AFRICA'S RETAIL BANKING LANDSCAPE

    SHOPRITE AND INVESTEC JOIN FORCES TO TRANSFORM SOUTH AFRICA'S RETAIL BANKING LANDSCAPE

    Global Business Outlook · few months ago

  • ⚡ THE RARE-EARTH SHOCK: YTTRIUM PRICES EXPLODE AS CHINA TIGHTENS GLOBAL SUPPLY

    ⚡ THE RARE-EARTH SHOCK: YTTRIUM PRICES EXPLODE AS CHINA TIGHTENS GLOBAL SUPPLY

    Global Business Outlook · few months ago

  • 🏦 JAPAN'S BANKING GIANTS RAISE PROFIT FORECASTS AS HIGHER INTEREST RATES BOOST EARNINGS

    🏦 JAPAN'S BANKING GIANTS RAISE PROFIT FORECASTS AS HIGHER INTEREST RATES BOOST EARNINGS

    Global Business Outlook · few months ago

  • Yttrium's Ninefold Price Shock: How China's Export Controls Are Reshaping Global Critical-Mineral Supply Chains

    Yttrium's Ninefold Price Shock: How China's Export Controls Are Reshaping Global Critical-Mineral Supply Chains

    Vikas Garg · few months ago

More from Consulting Expert

FDA Orders Class-Wide Safety Warnings on GLP-1 Medications Over Rare, Vision-Threatening Eye Condition
Industry Report

FDA Orders Class-Wide Safety Warnings on GLP-1 Medications Over Rare, Vision-Threatening Eye Condition

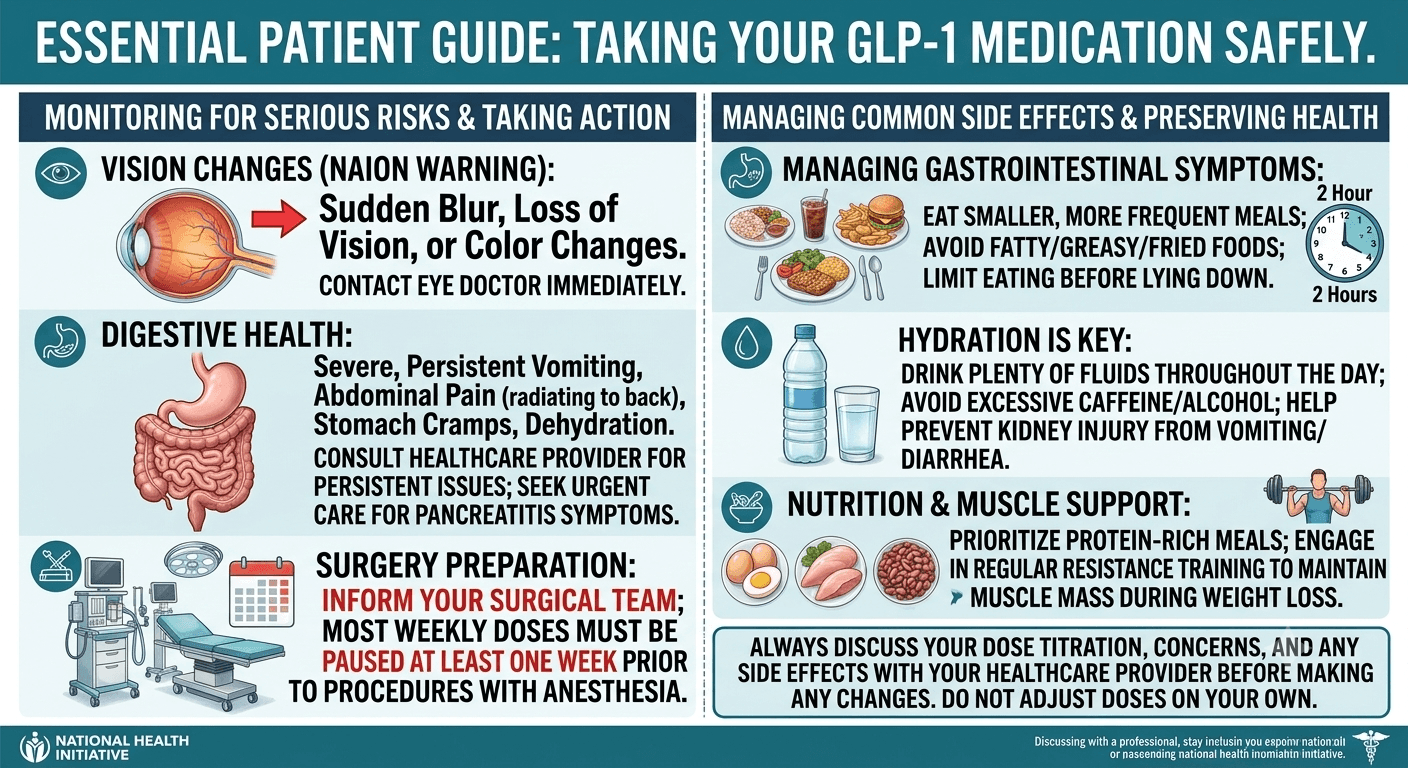
The U.S. Food and Drug Administration (FDA) has officially mandated safety labeling changes across the entire class of glucagon-like peptide-1 receptor agonists (GLP-1 RAs) and dual-agonist therapies. This regulatory decision introduces a formal warning regarding non-arteritic anterior ischemic optic neuropathy (NAION), a serious and rare eye condition linked to potential permanent vision loss. The decision follows a mounting body of observational research and postmarketing surveillance reports tying blockbuster diabetes and weight-loss drugs—such as Ozempic, Wegovy, Mounjaro, and Zepbound—to optic nerve vascular complications. What Is NAION and Why Is It a Serious Concern? Non-arteritic anterior ischemic optic neuropathy is a rare medical condition commonly referred to as an "eye stroke." It occurs when there is a sudden decrease or cessation of blood flow through the short posterior ciliary arteries directly supplying the head of the optic nerve. Without consistent arterial blood flow, optic nerve tissue experiences rapid acute ischemia, leading to axonal swelling, structural compromise, and tissue infarction. Clinical Presentation and Symptoms to Watch For Sudden Painless Vision Loss: The primary hallmark of NAION is an acute drop in vision without physical eye pain. Patients frequently notice visual deficits immediately upon waking up due to nocturnal drops in systemic arterial pressure. Visual Field Defects: Affected individuals often develop altitudinal deficits, where whole sections of vision—most commonly the lower half—appear missing, shadowed, or blurred. Blind spots and severe tunnel vision can also develop. Color Distortion and Sharpness Impairment: Central sharpness drops noticeably, accompanied by dyschromatopsia, where colors appear faded, washed out, or distorted. Contralateral Eye Risk: Once NAION occurs in one eye, clinical data indicates a heightened cumulative statistical risk of 15% to 24% over five years for the same condition to strike the fellow eye. Overlapping Pre-existing Risk Factors The biological vulnerability to NAION overlaps heavily with the underlying health conditions GLP-1 medications are designed to treat: Long-standing Type 2 Diabetes Mellitus with microvascular changes Systemic Hypertension (high blood pressure) Obstructive Sleep Apnea and nocturnal hypoxic episodes Elevated Body Mass Index (Obesity) Active tobacco smoking, hyperlipidemia, and underlying kidney disease Affected Medications: A Class-Wide FDA Mandate Unlike prior European regulatory reviews by the European Medicines Agency (EMA) Pharmacovigilance Risk Assessment Committee (PRAC)—which concentrated primarily on semaglutide—the FDA's directive applies broadly across all approved GLP-1 receptor agonists and dual-agonist medications. Semaglutide Formulations: Ozempic (weekly injection for diabetes), Wegovy (weekly injection for chronic weight management), and Rybelsus (daily oral tablet). Tirzepatide Dual Agonists: Mounjaro (weekly GIP/GLP-1 injection for diabetes) and Zepbound (weekly GIP/GLP-1 injection for weight loss). Liraglutide Products: Victoza (daily injection for diabetes) and Saxenda (daily injection for weight management). Dulaglutide Products: Trulicity (weekly injection for glycemic control and cardiovascular risk reduction). Fixed Combination Therapies: Xultophy (combining degludec insulin and liraglutide) and Soliqua (combining glargine insulin and lixisenatide). Other Formulations: Generic exenatide formulations and newer non-peptide oral candidates like orforglipron (Foundayo). The Scientific Spark: Real-World Data and Risk Metrics The catalyst for regulatory action was accelerated by a landmark cohort study published in July 2024 in JAMA Ophthalmology , led by researchers at Mass Eye and Ear in Boston. Type 2 Diabetes Cohort: Patients prescribed semaglutide for diabetes exhibited a cumulative 36-month NAION incidence rate of 8.9%, compared to 1.8% among patients on non-GLP-1 antidiabetic drugs. This yielded a statistical Hazard Ratio (HR) of 4.28 (95% CI: 1.62–11.29). Overweight and Obesity Cohort: Patients taking semaglutide for weight management demonstrated a 36-month cumulative incidence rate of 6.7%, compared to 0.8% in those prescribed non-GLP-1 weight-loss medications. This represented a Hazard Ratio (HR) of 7.64 (95% CI: 2.21–26.36). Baseline Population Context: In the general unmedicated population over 50 years of age, baseline NAION incidence remains rare, ranging between 2.3 and 10.3 cases per 100,000 person-years. Scientific Debate: Direct Causation vs. Confounding by Indication Medical researchers and pharmaceutical leaders remain divided over whether GLP-1 drugs directly trigger optic nerve ischemia or if observed correlations stem from observational bias: Proposed Direct Mechanisms: Researchers hypothesize that rapid shifts in blood glucose could trigger abrupt changes in optic disk microvascular autoregulation. Alternatively, GLP-1 induced nocturnal blood pressure drops could impair perfusion pressure at the optic nerve head. Confounding by Indication: Opposing clinical experts argue that patients prescribed GLP-1 therapies inherently possess higher rates of severe baseline vascular risk factors, including poorly controlled diabetes, severe obesity, and sleep apnea, all of which independently increase NAION risk. Manufacturer Statements: Companies such as Novo Nordisk and Eli Lilly maintain that large-scale randomized controlled clinical trial data encompassing tens of thousands of participants have not established a direct cause-and-effect link, reinforcing confidence in the overall therapeutic benefit-risk balance of these treatments. Action Steps and Clinical Management Guidelines To ensure safety while preserving cardiovascular and metabolic benefits, clinical guidelines highlight clear directions for clinicians and patients. Immediate Recommendations for Patients and Providers Seek Emergency Evaluation: Anyone experiencing sudden, painless vision loss, blurred spots, or altered color vision should contact a healthcare professional or seek emergency medical evaluation immediately. Ophthalmologic Referral: If NAION is suspected, doctors are advised to order an immediate referral to a specialist or neuro-ophthalmologist for baseline disk examination. Weighing Treatment Continuation: For patients diagnosed with NAION while taking a GLP-1 RA, clinicians must evaluate stopping the drug by weighing individual microvascular risks against essential benefits like glycemic control and cardiovascular protection. Medical Disclaimer Disclaimer: This article is intended solely for informational, educational, and news reporting purposes. It does not constitute formal medical advice, clinical diagnosis, or treatment recommendations. Individuals currently taking or considering glucagon-like peptide-1 (GLP-1) receptor agonist or dual-agonist medications should never alter, pause, or discontinue their prescribed dosage without direct consultation with a qualified healthcare provider. Anyone experiencing sudden vision changes, visual field loss, or acute side effects should seek immediate medical evaluation from an ophthalmologist or emergency healthcare facility.

#GLP1#GLP1Medications#FDA
Consulting Expert
The $600 Billion Monopoly Mandate: How Big Pharma Engineered Global Dependency in 2026
Market Study

The $600 Billion Monopoly Mandate: How Big Pharma Engineered Global Dependency in 2026

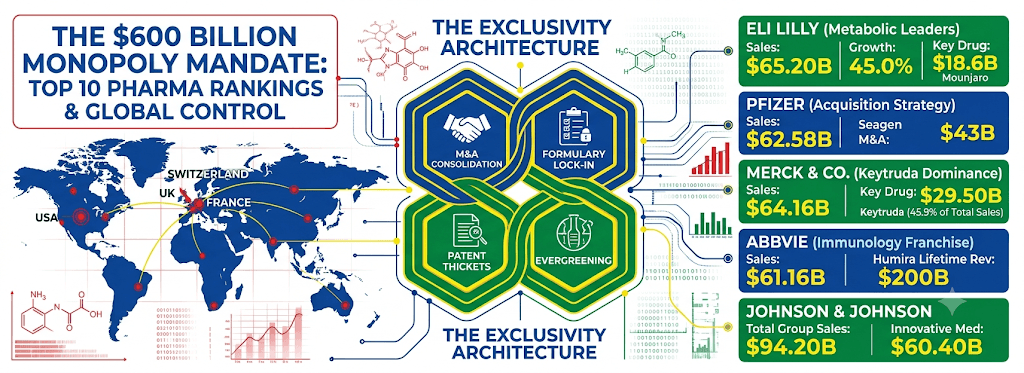
The upper echelon of the global pharmaceutical market is locked into a high-concentration structure, where the top ten corporate entities generate over $600 billion in cumulative annual sales. Leading the global revenue rankings is Eli Lilly , which achieved $65.20 billion in annual revenue, registering an industry-topping single-year organic growth rate of 45.0% . This expansion was driven almost entirely by its metabolic portfolio: $18.6 billion from Mounjaro and $9.0 billion from Zepbound . Close behind, Pfizer generated $62.58 billion in total revenue, managing to stabilize its top-line post-pandemic operations through its $43 billion acquisition of Seagen. AbbVie captured third place with $61.16 billion in revenue, sustained by its next-generation immunology assets: Skyrizi contributed $10 billion in annualized sales (growing 30.9% year-over-year), while Rinvoq generated $5.0 billion (up 23.3% ). Johnson & Johnson achieved $94.20 billion in total group revenues, with its Innovative Medicine (pharmaceuticals) division accounting for $60.40 billion . This segment grew by 6.1% , led by oncology blockbuster Darzalex at $12.4 billion and Tremfya at $6.0 billion . AstraZeneca generated $58.74 billion —posting an 8.0% growth rate—fueled by its oncology platform, including Tagrisso . Merck & Co. recorded $64.16 billion in total enterprise sales, with $58.14 billion derived directly from drug sales. Merck’s single immuno-oncology treatment, Keytruda , reached $29.50 billion in sales—making it the highest-selling drug on Earth and accounting for 45.9% of Merck’s entire corporate revenue. Roche generated $74.90 billion in enterprise revenue, with its core Pharmaceuticals Division delivering $57.57 billion , supported by Ocrevus at $4.30 billion and Vabysmo at $2.50 billion . Swiss partner Novartis delivered $54.53 billion by targeting specialized radioligands and cardiovascular platforms like Entresto . Bristol Myers Squibb posted $48.19 billion , anchored by Opdivo . Rounding out the top ten, Sanofi S.A. generated $47.42 billion , heavily anchored by its immunology blockbuster Dupixent , which delivered $10.70 billion in half-year sales alone while growing at 30.8% . The Structural Engine of Monopolistic Growth Monopolistic control across the top ten players is maintained through deliberate legal and financial strategies rather than free-market competition. The foundation of this control is the Patent Thicket . A prominent example is AbbVie's primary asset Humira , which was ring-fenced by 132 granted secondary patents out of 247 patent applications . This legal perimeter successfully blocked biosimilar entry into the United States market for 20 years , allowing AbbVie to extract over $200 billion in cumulative lifetime revenue from a single drug molecule. Similarly, Merck has secured over 120 patent filings surrounding Keytruda , extending its exclusive pricing power far beyond its primary compound expiration milestone. The second key tactic is Acquisition over Discovery . The top ten pharma firms allocate an average of 15% to 28% of net revenues to R&D, but a massive portion of this capital functions as private equity. The top ten giants executed over $140 billion in clinical-stage M&A investments, acquiring late-stage biotechnology assets at Phase II or Phase III milestones rather than bearing early-stage discovery risk. Third, revenue stability is reinforced through Pay-for-Delay Settlements . Historical antitrust analyses reveal that branded pharmaceutical manufacturers have engaged in financial arrangements with prospective generic entrants that offer up to 30% to 50% of monopoly profits in royalty or supply-chain agreements. In exchange, the generic entrant defers product launches by 3 to 7 years , keeping consumer pricing artificially high. Engineering Unbreakable Global Dependencies Beyond legal exclusivity, the top ten pharmaceutical companies have engineered structural, physical, and financial dependencies throughout the global healthcare ecosystem. Manufacturing & Bioreactor Monopolization: While generic small-molecule pills cost less than $0.05 per dose to synthesize, modern complex biologics and GLP-1 peptide chains require advanced bioreactor facilities costing between $500 million and $2 billion per site. The top ten firms control an estimated 70% of global commercial-scale mammalian cell culture capacity . This creates a high capital barrier, preventing low-income nations or secondary competitors from manufacturing biosimilars even when legal compulsory licenses are granted. Clinical Trial & Regulatory Hegemony: Securing global marketing approval across regulatory bodies like the US FDA, European EMA, and Chinese NMPA requires global Phase III trials. The median cost of executing a successful Phase III trial program across 5,000 to 10,000 patients now ranges between $300 million and $1.1 billion . Independent biotech firms holding novel targets find it nearly impossible to finance these trials independently, forcing over 80% of independent biotechs to license their assets to top ten pharma players to reach international markets. Formulary Lock-In via PBM Rebate Bundling: In the United States—the world's most lucrative market, accounting for 45% of global drug spending —the top ten players utilize portfolio rebate bundling with Pharmacy Benefit Managers (PBMs). A PBM managing tens of millions of patient lives is offered gross-to-net price concessions and volume rebates of 40% to 65% across established multi-billion dollar franchises, provided that the PBM grants exclusive, Tier-1 formulary access to the manufacturer’s entire product catalog. This practice effectively blocks lower-cost generic alternatives from gaining market access. Through a combination of structural patent thickets, manufacturing dominance, and aggressive capital deployment, the top ten pharmaceutical corporations have insulated their financial positions. They ensure that even as individual patents expire, the broader system of global dependency guarantees sustained revenues. November 2026

#Pharmaceuticals#BigPharma#HealthcareEconomics
Consulting Expert
Dubai's Strategic Leap: Sheikh Hamdan Approves $544M Urban Plan, Sustainable Population Policy, and Digital Authorisation System
Industry Report

Dubai's Strategic Leap: Sheikh Hamdan Approves $544M Urban Plan, Sustainable Population Policy, and Digital Authorisation System

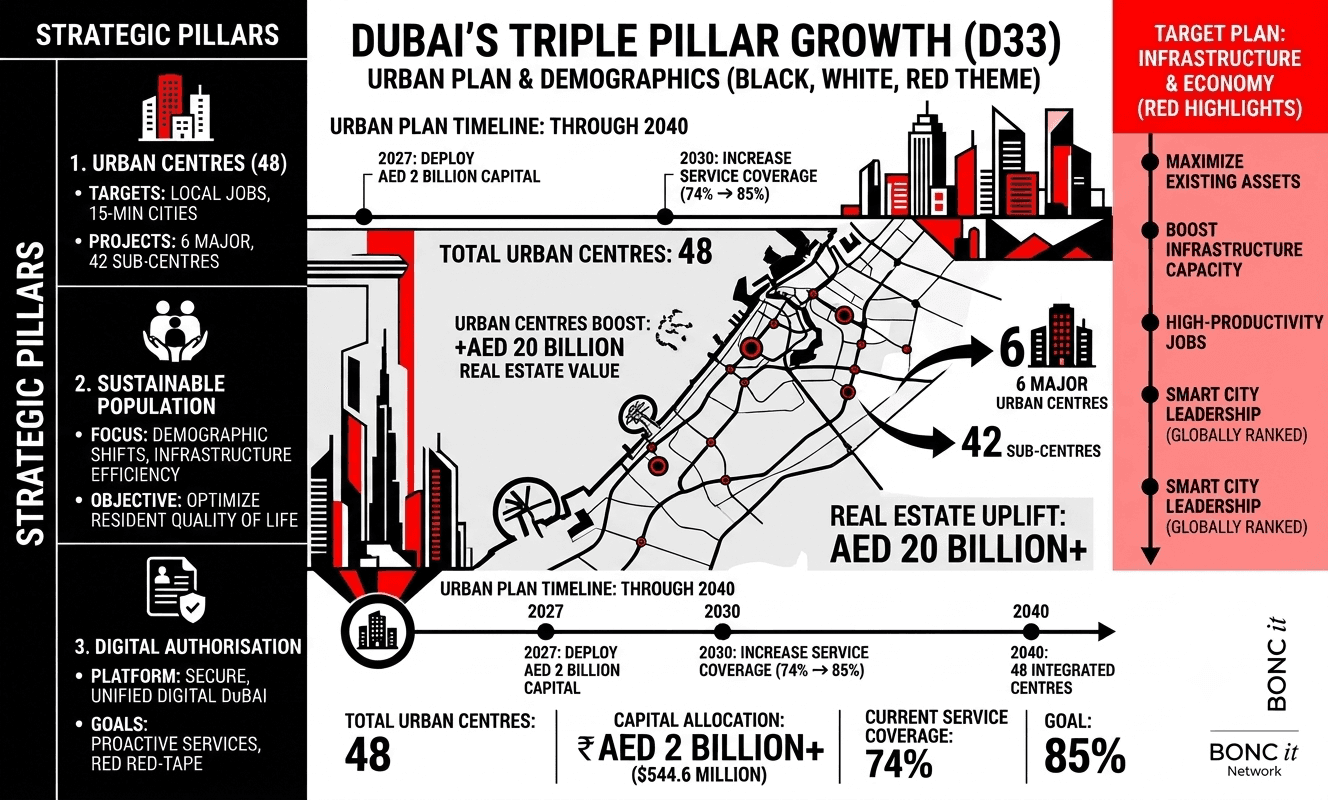
The Executive Council of Dubai, led by Sheikh Hamdan bin Mohammed bin Rashid Al Maktoum—Crown Prince of Dubai, Deputy Prime Minister, and Minister of Defense—has rolled out a comprehensive multi-pillar policy package. Designed to synchronize urban growth, demographic management, and digital government infrastructure, the sweeping initiatives aim to generate an estimated AED 20 billion boost in real estate values while setting new global benchmarks for urban living and digital public services. Q: What was announced? Dubai’s Executive Council, led by Sheikh Hamdan, approved a major three-part policy package covering urban center redevelopment, sustainable demographic planning, and digital government authorizations. Q: Where is the money going? Over AED 2 billion ($544.6M) will fund the Urban Centres Development Plan , targeting 48 specific districts (6 main hubs + 42 sub-centers). The goal is to bring public service coverage in these zones from 74% to 85% and reduce transit times between homes and workplaces. Q: What is the financial upside? Real estate valuations in these 48 targeted areas are projected to jump by AED 20 billion ($5.45B) by 2040. Q: How does the new Digital Authorisation System work? Using UAE PASS , individuals and businesses can digitally grant authorization to third parties for low-risk transactions—completely eliminating traditional notary public visits and paper processes while maintaining 100% fraud protection. 1. The Urban Centres Development Plan ($544.6 Million Investment) At the forefront of the announcement is a capital allocation exceeding AED 2 billion ($544.6 million) through 2040, aimed at restructuring 48 urban districts across the emirate. Decentralized Footprint: The blueprint targets 6 main urban centres and 42 supporting sub-centres , encompassing roughly 12 percent of Dubai’s total urban area. Infrastructure Enhancement: Public service and municipal coverage across these designated zones is projected to rise from 74 percent to 85 percent. Economic Valuation: Beyond localized community development, the plan is structured to unlock an estimated AED 20 billion in property value uplift , bridging the physical gap between residential districts and employment hubs. 2. Sustainable Population Planning Policy Complementing the spatial development strategy, the Executive Council approved the Sustainable Population Planning Policy , a data-driven framework linking demographic shifts directly to economic and urban forecasting. Anticipating Growth: The policy leverages advanced population forecasts to project future service and infrastructure needs, ensuring development aligns with the realities of a cosmopolitan community comprising over 200 nationalities. Targeting High-Productivity Jobs: By aligning population growth with the targets of the Dubai Economic Agenda (D33) , the framework supports job creation in high-productivity sectors, attracts global talent, raises average family incomes, and reinforces local purchasing power. Optimizing Existing Assets: The initiative focuses on maximizing the efficiency and sustainability of current infrastructure, ensuring municipal growth matches the aspirations of both citizens and residents. 3. Digital Authorisation System for Individuals and Companies To advance public sector digital transformation, the Council approved a new Digital Authorisation System , operated via a unified platform developed by Digital Dubai. Paperless Delegations: The system enables individuals and companies to securely authorize third parties to complete low-risk government transactions on their behalf without requiring traditional notary public or legal attestation procedures. Security & Efficiency: Built on UAE PASS digital identity verification, the platform targets a 100 percent digital experience, complete effectiveness in mitigating fraud and operational disputes, and a 90 percent score on the Customer Effort Index. Global Smart City Standing: Coming on the heels of Dubai ranking second globally in the 2026 Smart City Index , the system reinforces the emirate's push toward frictionless, real-time, paperless government administration. In Brief: A Unified Blueprint for Future Growth Dubai’s latest policy approvals reflect an integrated governance approach where spatial infrastructure, demographic planning, and digital administration operate as a single engine. By combining heavy capital deployment in regional urban centers with advanced population forecasting and secure digital tools, Dubai continues to cement its competitive edge as a global hub for talent, investment, and enterprise. In tandem with a data-backed Sustainable Population Policy, Dubai is setting a global benchmark for how digital-first infrastructure directly powers economic competitiveness. Dubai | October 27, 2026

#SheikhHamdan#DubaiExecutiveCouncil#DubaiVision2040
Consulting Expert